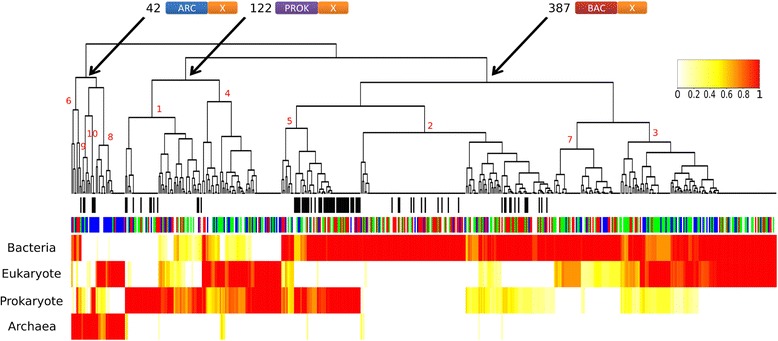
Fig. 4.

Hierarchical clustering of S-gene families according to their component origins. The heatmap represents the ratio of genes in a given family (columns) that have at least one component of a given origin (eukaryotic, archaeal, bacterial or prokaryotic; the rows). White lines correspond to the absence of a component from a given origin in every gene in the given S-gene family. The colored lines correspond to the presence of at least one component of the given origin in a given percentage of genes in the given S-gene family (red lines denote that all (100%) genes contain a given origin component). The first colored top bar indicates the functional annotation. The black bars in the second colored top bar indicate the reclassified S-genes after applying the HMM-profile procedure. Cluster 1 roughly corresponds to 60 S-genes with only prokaryotic components (PROK-PROK), clusters 2 and 7 roughly correspond to 203 S-genes with only bacterial components (BAC-BAC), cluster 3 roughly corresponds to 122 S-genes with bacterial and eukaryotic components (BAC-EUK), cluster 4 roughly corresponds to 62 S-genes with prokaryotic and eukaryotic components (PROK-EUK), cluster 5 roughly corresponds to 62 S-genes with prokaryotic and bacterial components (PROK-BAC), cluster 6 roughly corresponds to 8 S-genes with bacterial and archaeal components (ARC-BAC), cluster 8 roughly corresponds to 23 S-genes with archaeal and eukaryotic components (ARC-EUK), cluster 9 roughly corresponds to 7 S-genes with only archaeal components (ARC-ARC), and cluster 10 roughly corresponds to 4 S-genes with prokaryotic and archaeal components (ARC-PROK)
