
Figure 2. Fibrinogen Activates BMP Signaling in OPCs.
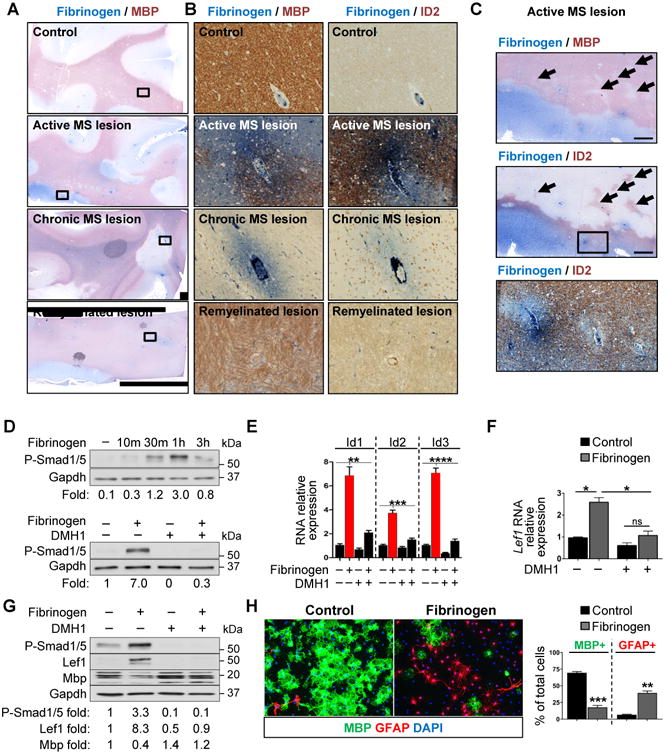
, (A-C) Immunohistochemistry for fibrinogen (blue) and either MBP (red) or Id2 (red) in active, chronic, and remyelinating MS lesions. (A) Boxes show location of images in B. Scale bar: 2 mm. (B) Scale bar: 100 μm (C) Box shows location of bottom image. Arrows indicate areas of demyelination with increased Id2 immunoreactivity. Scale bar: 1 mm (top images), 100 μm (bottom).
(D) Top: P-Smad1/5 levels in primary rat OPCs treated with fibrinogen for the indicated time. Bottom: P-Smad1/5 levels in control or fibrinogen-treated primary rat OPCs in the presence of the BMP receptor inhibitor DMH1. Values are mean of n = 2 independent experiments.
(E) Id1-3 in primary rat OPCs treated with fibrinogen for 3 h and DMH1. Values are mean ±s.e.m. from n = 3 independent experiments. **p < 0.01, ***p < 0.001, ****p < 0.0001 (two-wayANOVA with Bonferroni).
(F) Lef1 in primary rat OPCs treated with fibrinogen for 48 h and DMH1. Values are mean ±s.e.m. from n = 2 independent experiments. ns = not significant, *p < 0.05 (two-way ANOVAwith Bonferroni).
(G) P-Smad1/5, Lef1, and MBP in primary rat OPCs treated with fibrinogen and DMH1 for 4 days. Representative immunoblot and densitometry from n = 2 independent experiments.
(H) Immunofluorescence for MBP (green) and GFAP (red) in primary rat OPCs treated with fibrinogen or control. Nuclei are stained with DAPI. Representative images from n = 3 independent experiments. Scale bar: 50 μm. Values are mean ± s.e.m., **p < 0.01, ***p < 0.001 (unpaired t-test).