
Figure 4. Therapeutically Depleting Fibrinogen Increases Remyelination in Vivo.
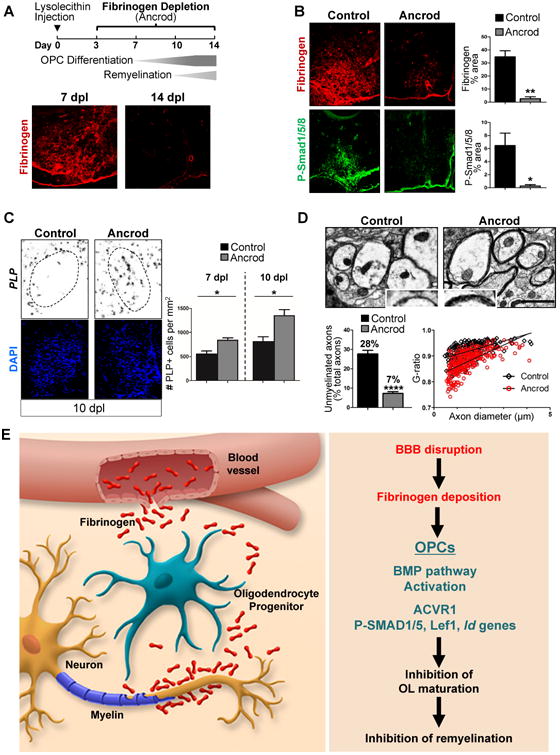
(A) Top: LPC injections with fibrinogen depletion using Ancrod. Bottom: Immunostaining for fibrinogen (red) in LPC-induced demyelinated lesions in ventral spinal cord of mice at 7 and 14 dpl. Dotted lines: lesion border. Representative images are shown. Scale bar: 100 μm.
(B) Immunostaining for fibrinogen (red) and P-Smad1/5/8 (green) in LPC lesions in ventral spinal cord of mice treated with ancrod or vehicle control at 7 dpl. Dotted lines: lesion border. Quantification of fibrinogen and P-Smad1/5/8 immunoreactivity from n = 3 mice per group. Values are mean ± s.e.m. *p<0.05, **p<0.01 (unpaired t-test). Scale bar: 100 μm.
(C) In situ hybridization for PLP mRNA (black) labeling mature OLs in LPC lesions in ventral spinal cord of mice treated with ancrod or vehicle control at 10 dpl. Nuclei are stained with DAPI (blue). Dotted lines: lesion border. Quantification of PLP+ cells within LPC lesions at 7 and 10 dpl from n = 3–4 mice per group. Values are mean ± s.e.m. *p < 0.05 (unpaired t-test). Scale bar: 100 μm.
(D) Electron microscopy of remyelinating axons within LPC lesions at 14 dpl in ancrod-treated and control mice. Inset image (blue box) shows close-up of myelin sheath (black). Quantification of axons within LPC lesions that remained unmyelinated at 14 dpl from n = 4 mice per group. Values are mean ± s.e.m. **** p <0.0001 (unpaired t-test). G-ratios between controls (G ratio mean = 0.92, s.e.m. = 0.002) and the ancrod group (G ratio mean = 0.88, s.e.m. = 0.003). n = ∼75 axons counted per mouse, 4 mice per group. ****p < 0.0001 (unpaired t-test). Scale bar: 1 μm.
(E) Working model of fibrinogen in CNS remyelination. Fibrinogen enters the CNS after BBB disruption and has pleiotropic functions as an inducer of inflammatory responses and inhibitor of regeneration.