Fig. 3.

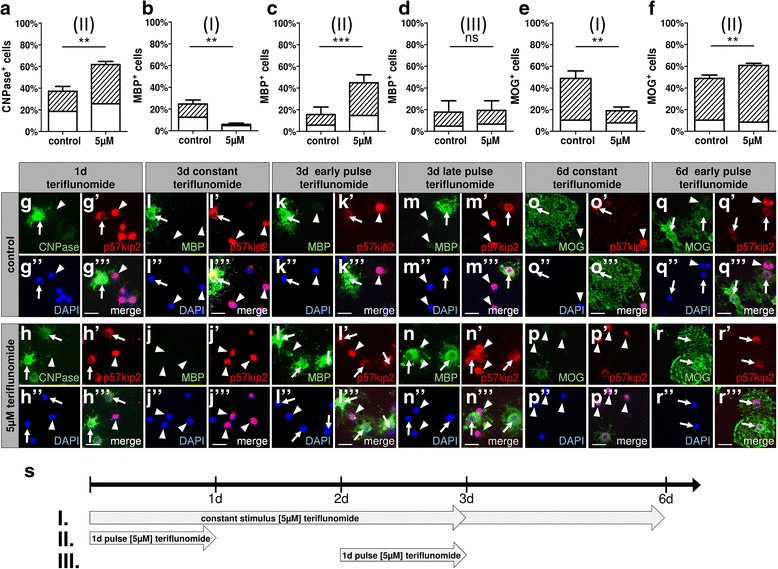
OPC differentiation dynamics and marker protein responses as a function of different teriflunomide application schemes. a–f Percentage of oligodendroglial cells positive for myelin markers displaying nuclear (white bars) or cytoplasmic (dashed bars) p57kip2 signals. a, g–h”’ After short-term stimulation with 5 μM teriflunomide (s; scheme II), an increase of CNPase-positive cells was observed along with increased translocation of p57kip2 from the nucleus (arrowheads) to the cytoplasm (arrows). c, k–l”’ A 24 h pulse stimulation (scheme II) with teriflunomide followed by a 48-h (or 120-h; f, q–r”’) withdrawal period led to a substantial increase in the fraction of oligodendroglial cells that translocated p57kip2 from the nucleus to the cytoplasm and correlated with an increase of MBP- and MOG-positive cells, respectively. b, i–j”’ On the other hand, long-term stimulation (scheme I) over 72 h (or 144 h; e, o–p”’) resulted in a decrease of cells expressing MBP or MOG and boosted nuclear accumulation of the p57kip2 protein. d, m–n”’ Moreover, a short-term pulse at a later time point from 48 to 72 h (scheme III) did not affect oligodendroglial differentiation. Data are shown as mean, and error bars represent SEM. Number of experiments: n = 3 (a–f). t test (ns, not significant, **p < 0.01, ***p < 0.001). Scale bars, 20 μM
