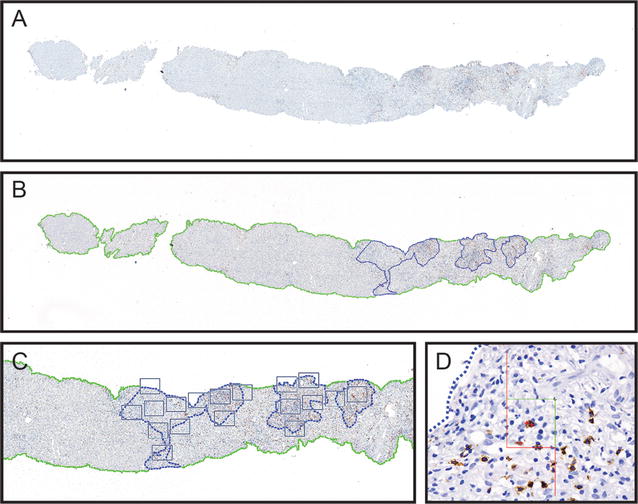
Fig. 1.

Representative images showing quantification procedure using NewCAST™ Visiopharm® software. Super image capture of a tissue slide (A); computer-assisted drawing of the whole tissue (green line) and manually drawn portal areas as regions of interest (ROI) in blue (B); selected areas within the ROIs by random sampling (grey squares) (C); counting frame within one field of view at 400 magnification (D)
