. 2017 Sep 18;8(11):7696–7704. doi: 10.1039/c7sc03362a

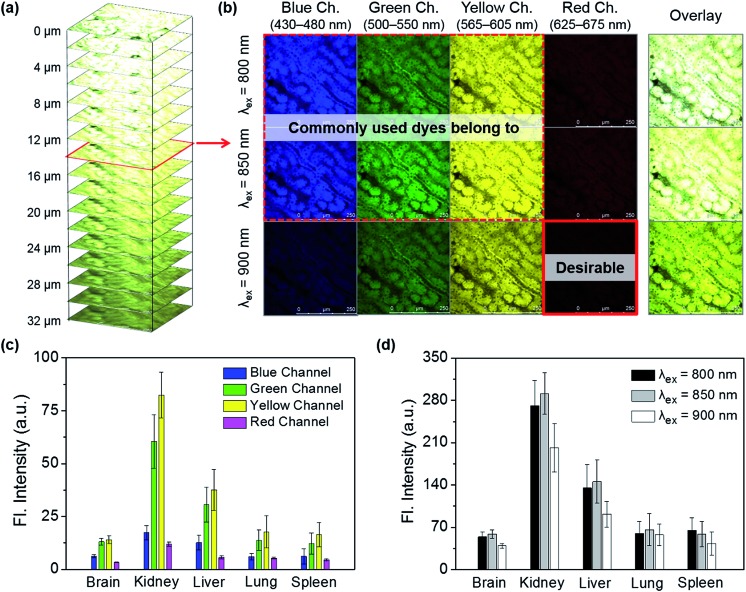
Fig. 2. (a) Autofluorescence images of a kidney tissue sample, z-stacked from the surface to 32 μm depth and obtained under excitation at 850 nm. (b) Autofluorescence images of the kidney tissue at a depth of 14 μm, obtained by exciting at different excitation wavelengths (800, 850, and 900 nm) and collecting through different emission channels (blue, 430–480 nm; green, 500–550 nm; yellow, 565–605 nm; red, 625–675 nm). (c) Comparison of the total autofluorescence intensity, which is dependent on the organ tissues (brain, kidney, liver, lung, and spleen) and the emission channels; each bar graph represents the total fluorescence intensity of all of the z-stacked images (shown in “(a)”) that were obtained by exciting at 850 nm and collecting through the given emission channel. (d) Comparison of the total autofluorescence intensity, which is dependent on the organ tissues and excitation wavelengths (800, 850, and 900 nm); each bar graph represents the total fluorescence intensity of all of the z-stacked images (shown in “(a)”) that were obtained by exciting at the given wavelength and collecting through the whole channel. The laser power was 95 mW at the focal point. The scale bar is 250 μm.

Fig. 2