Figure 1.

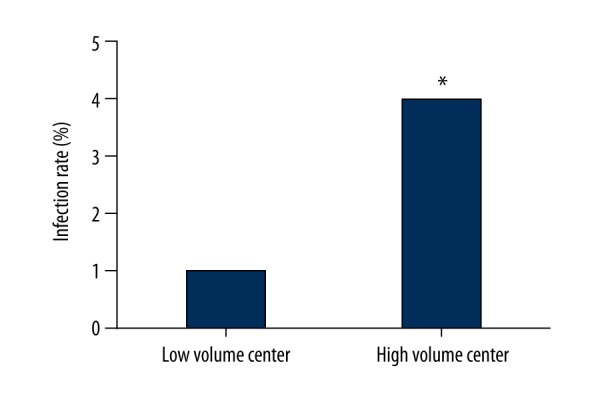
Comparison of CDI rate in low-volume centers and the high-volume center. Columns indicated the CDI rates in low-volume centers and high-volume center. [* difference is significant when compared with low-volume centers (P<0.05)]

Comparison of CDI rate in low-volume centers and the high-volume center. Columns indicated the CDI rates in low-volume centers and high-volume center. [* difference is significant when compared with low-volume centers (P<0.05)]