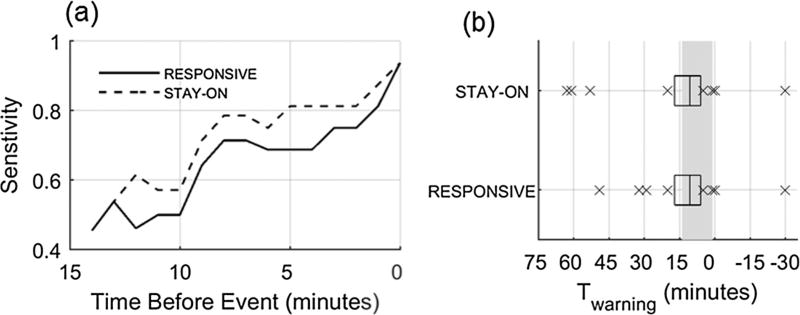
Fig. 4.
(a) Sensitivity considering a true positive at every minute leading up to the event from Tmax until tevent. (b) Distribution of Twarning for true positive warning episodes (time warning is activated for a warning episode present within [Tmax, Tmin]). Box plots where center line is the median, box edges are 25th and 75th percentiles, and crosses are values outside the 25th and 75th percentiles. Gray rectangle indicates [Tmax, Tmin] window.

