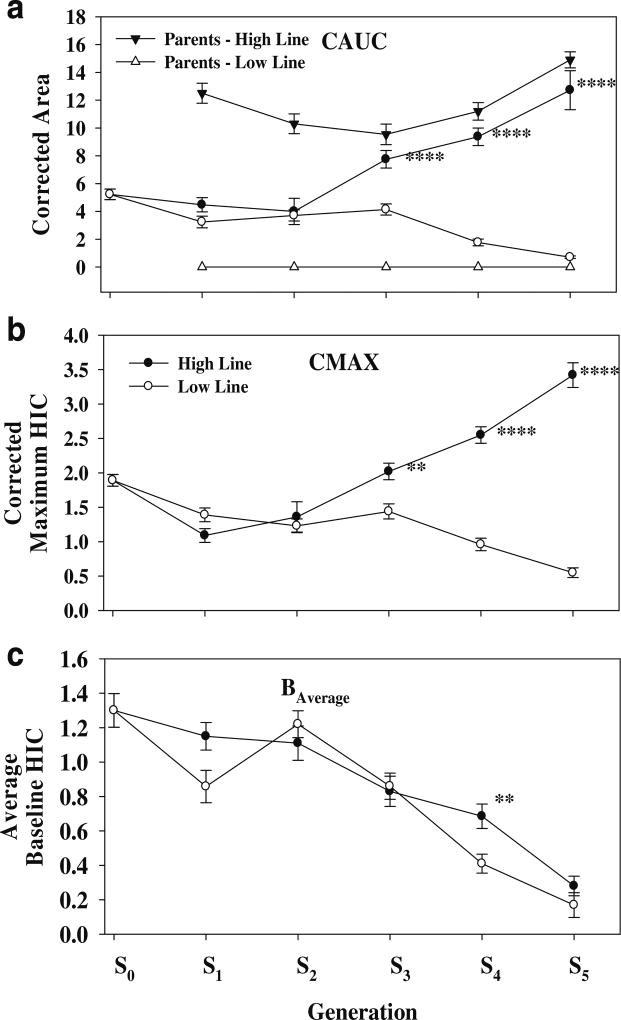
Fig. 2.
Short-term selection for acute ethanol withdrawal. a The response to selection in the High and Low responding lines. The average CAUC for the parents at each generation of selection is also illustrated. b The effects of selection on the corrected maximum HIC score (CMAX). c The effects of selection on the average baseline score. Asterisks indicate High line significantly different from respective Low line value. **p<10−2; ****p<10−4

