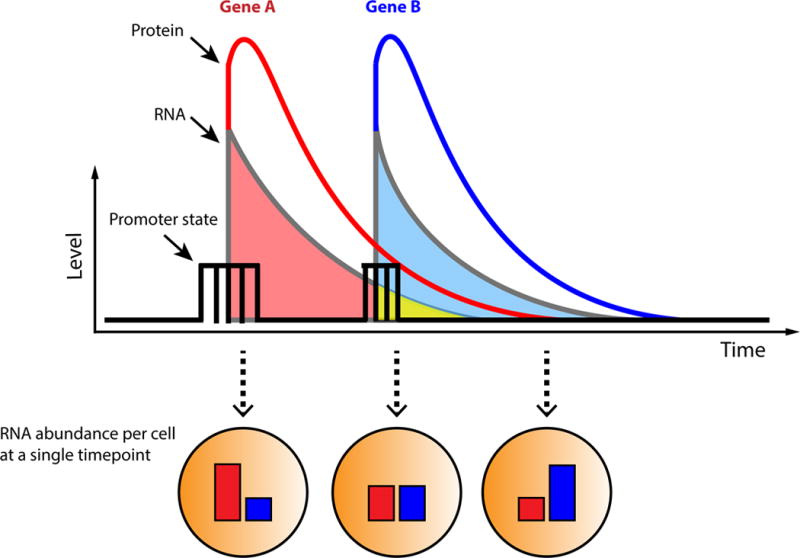
Figure 3. Capturing dynamic transcription regulation at a single timepoint.

The plot shows a hypothetical gene regulatory interaction Gene A → Gene B, where the protein product of Gene A promotes the expression of Gene B (i.e. the interaction between a transcription factor and its gene target). This interaction may be present in every cell of a population; however, each cell may be at different stages of the regulatory process at any given point in time. As such, fixing the population at a single time point (as is done for smFISH and scRNA-seq) may yield different combinations of Gene A and Gene B mRNA with no apparent correlation at the single cell level. As illustrated in the figure, the half-lives of both mRNA species may affect the degree to which they overlap in time (highlighted in yellow) within a single cell.
