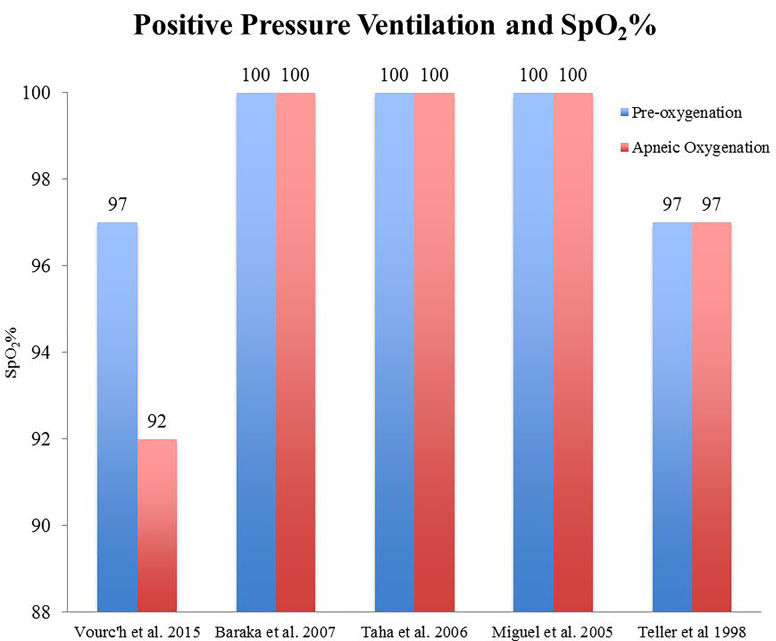
Figure 2.
Positive pressure ventilation and peripheral oxygen saturation (SpO2) %. Patients were recorded on their initial SpO2% and lowest SpO2% during intubation. Each patient’s oxygen saturation level was raised before intubation to the respective blue lines before undergoing intubation with nasal cannula use. Red lines represent lowest SpO2 levels reached during intubation with nasal cannula usage. Vourc’h et al., 2015 reported a mean pre-oxygenation and median apneic oxygenation SpO2%, respectively.

