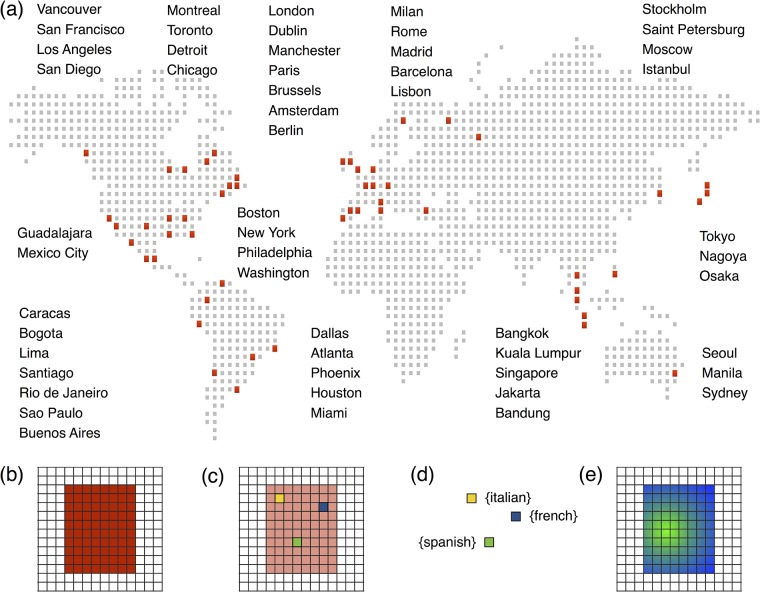
Fig 1. Dataset and framework description.
The cities passed through the lens of our analysis are mostly distributed over four continents (a). Africa has been not considered due to the lack of data. We cover each city with a square grid in order to keep a homogeneous spatial division over the whole urban area where the users are going to be distributed (b), selecting resident users and their most frequent location thanks to their activity over space and time (c). In addition, we assign the users’ most probable native language (d) and perform a spatial analysis over the cities (e) to get information about the population distribution in function of the language spoken by the users.

