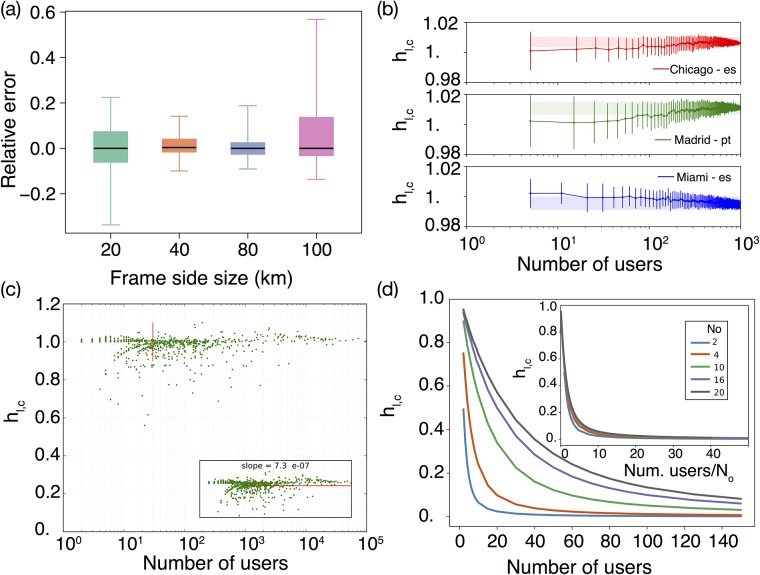
Fig 3. Evaluation of the migrant communities spatial distribution.
(a) Box plots of the relative change ϵl,c of the link weights in the bipartite spatial integration network taking as reference the 60 km side frame. (b) The entropy ratio hl,c for three examples of communities with more than 1000 detected users (Spanish in Chicago and Miami and Portuguese in Madrid). A random sub-sampling is extracted and the calculated ratio of entropies is displayed as a function of the sample size. (c) The ratio of entropies hl,c as a function of the community size in number of users with a valid residence for all the communities. Every points represent a linguistic community in a city. The red vertical line marks the level of 30 users taken as a threshold. In the inset, it is shown a zoom-in with the details of the main plot. (d) We present the results concerning the ratio of entropies of a null model in which users belonging to a immigrant community is allowed to reside only in a subset N0 of cells. These users are distributed randomly in the N0 cells, while the local population is randomly distributed across all the gird cells. In the numerical examples, the system contains 100 × 100 = 10000 cells. The figure shows how the ratio of entropies changes with the number of users in the immigrant community and how the curves depend in first order on the ratio between the number of users and N0.

