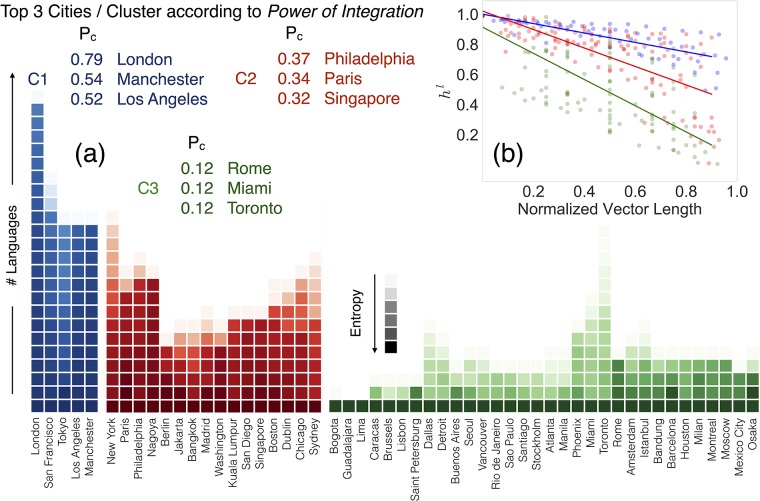
Fig 4. Clusters of cities and Power of Integration.
In (a), three groups of cities show similar behavior in the number of communities detected and in their levels of integration. The length of the vectors represents the number of languages (communities) detected in each city; the color scale is representative of the decay of the entropy metric; the Power of Integration metric lead us to evaluate the potential of each city in uniformly integrating immigrant communities within its own urban area according to entropy values. In (b), decay of hl,c for the cities in each cluster. The points correspond to the values of the elements of for each city placed in the x axis according to their index normalized to the total number of languages in c. The colors are for cities in the different clusters (C1 blue, C2 red and C3 green), and the lines are minimum square fits to the values of entropy ratios of each cluster.

