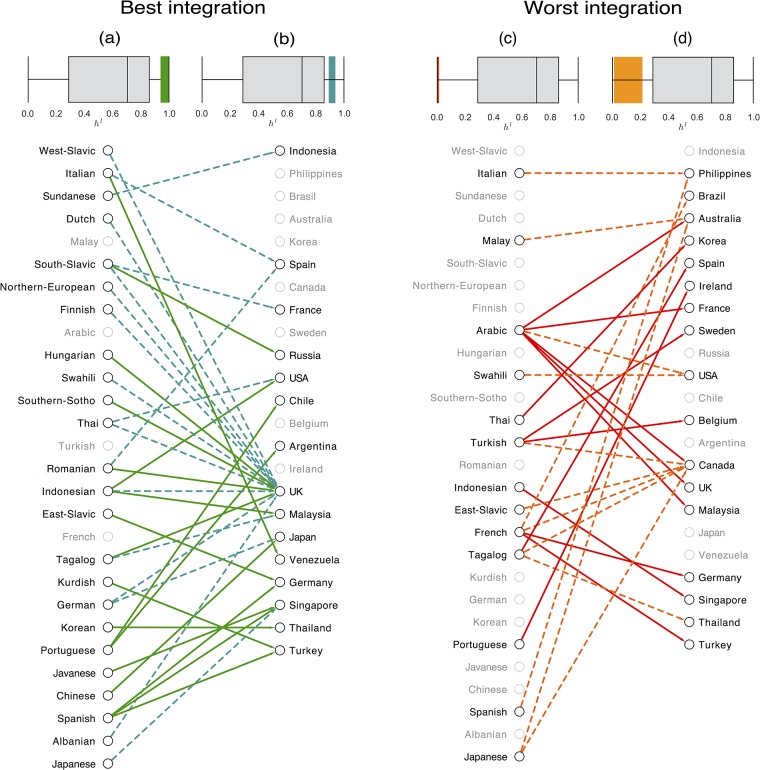
Fig 5. Language integration network.
We select the sub-network representative of the best levels of spatial integration of languages in countries and display it on the left of the figure. The network is formed by the top 10% links according to the entropy distribution (the spread of the values can be seen in the boxplot (a) in comparison with all the values of hl,c). In addition, we include an extra 10% of links (dash-lines) to the network, those between 10% and 20% best links (their spread is in the boxplot (b)). In the network only nodes that belong to the top set are highlighted. Similarly, on the right, the worst levels of spatial integration of languages in countries are shown. We filter out the bottom 10% links according to the entropy distribution (their spread of values is in the boxplot (c)), and add an extra 10% of links to the network (dash-lines), those links between the 10% and 20% worst in the ranking. Their spread is in the boxplot (d). As before, only the nodes that belong to the worst set are highlighted.

