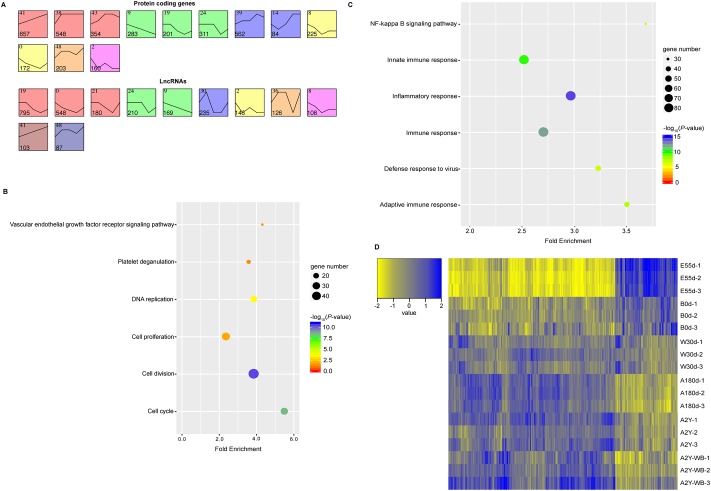
Fig 3. Time-series modules and co-expression network of lncRNAs and protein-coding genes.
(A) Time-series modules of protein-coding genes and lncRNAs. The top panel shows protein-coding genes and the second panel shows lncRNAs. Numbers in the top left corner indicate module number. Numbers in lower left corners indicate numbers of protein-coding genes or lncRNAs in each module. The same color was used to represent each cluster. Functional categories of genes in green (B) and red modules (C). Benjamini adjusted P values were transformed by ‒log10. (D) Heat map showing the largest two co-expression networks of protein-coding genes. Values represent log2(FPKM+1) of each gene in each sample minus the mean value of each gene across all samples.

