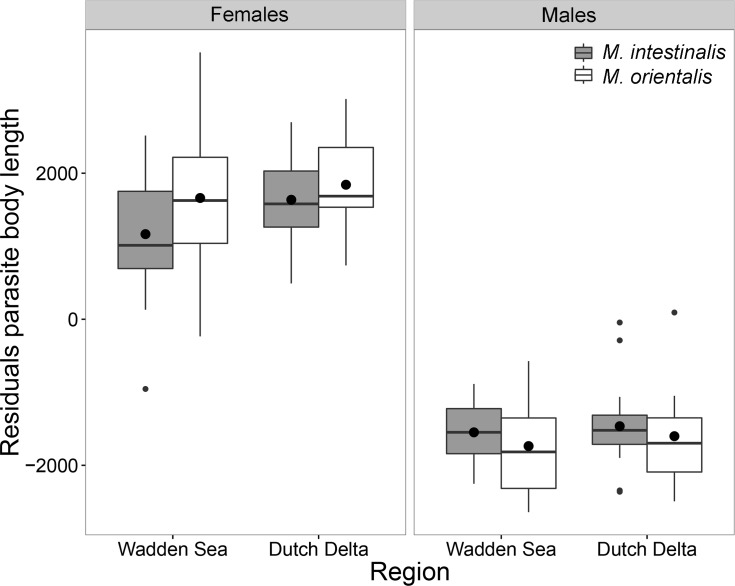
Fig 5. Parasite body length (corrected for host size using linear regression) for both introduced Mytilicola species.
Females (left) and males (right) of M. intestinalis (grey) and M. orientalis (white) in each surveyed region. The boxes represent the interquartile range, the whiskers denote the lowest and highest values within the 1.5 interquartile range, the black line in each box denotes the median, the large black dots represent the mean and the smaller dots outside the boxes are outliers.

