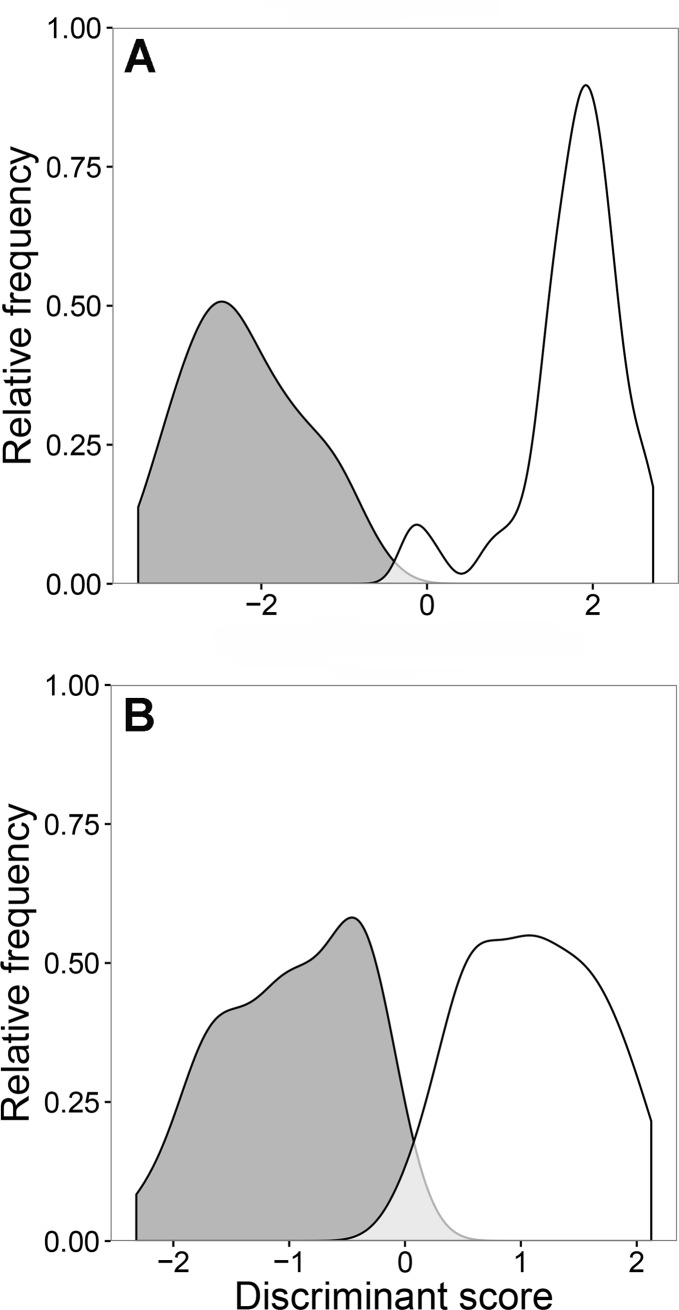
Fig 7. Discriminant distributions of Mytilicola for each sex separately.
(A) Females (n = 92) and (B) males (n = 90) of the parasitic copepods M. intestinalis (grey) and M. orientalis (white). The x-axis is the discriminant score of the first discriminant function and the y-axis is the relative frequency of the observations. The light grey area indicates “mistaken” assignments in comparison with molecular identifications.

