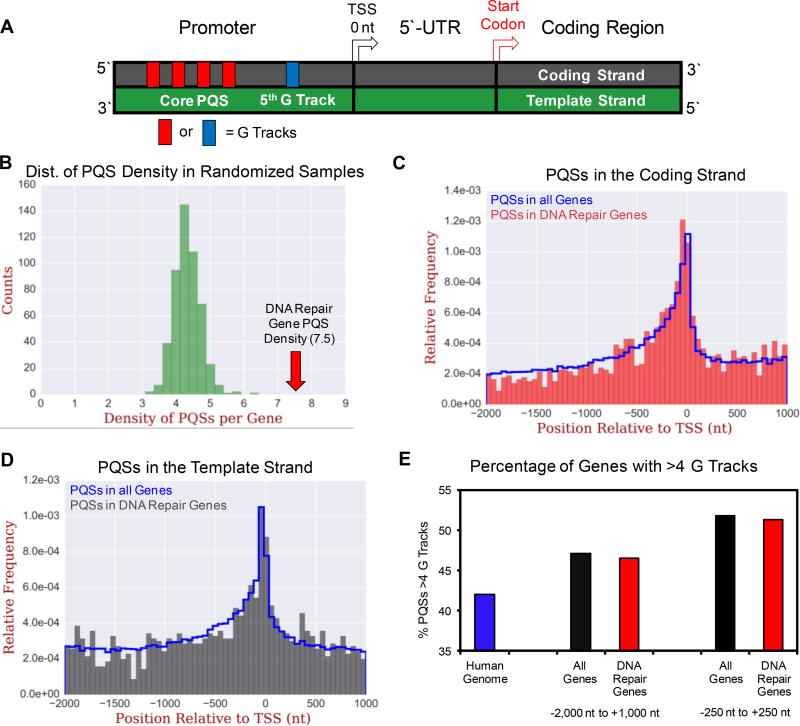
Figure 2.
Bioinformatic analysis of PQSs in all human genes compared to human DNA repair genes. (A) Diagram of a basic gene structure. (B) Average density of PQSs per gene from 500 randomized samples of 390 human genes per sample compared to the average density of PQSs in human DNA repair genes. (C) Location of PQSs in all human genes and human DNA repair genes on the coding strand or (D) template strand. (E) Counts of PQSs with more than four G tracks in all human genes (coding + non-coding) vs. human DNA repair genes.

