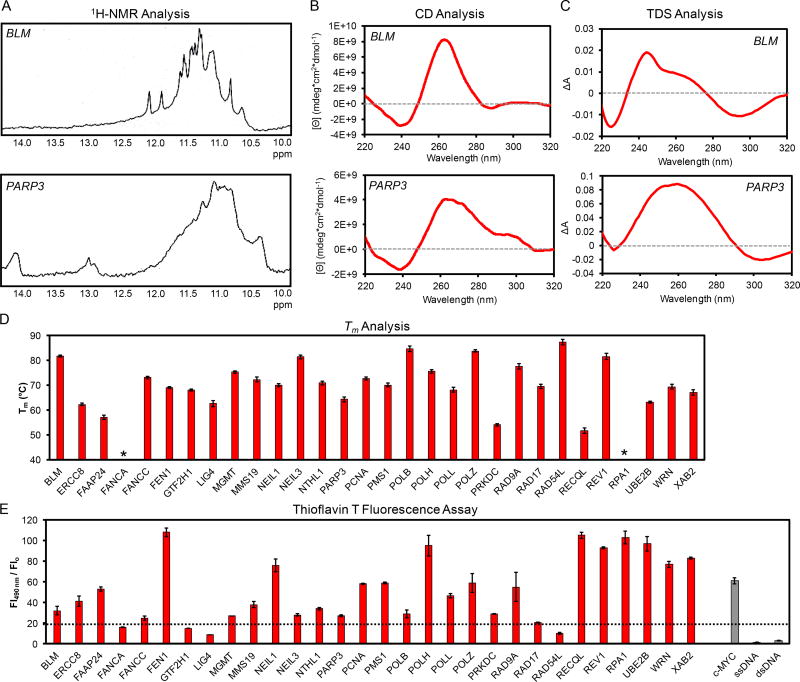
Figure 3.
Examples of (A) 1H-NMR, (B) CD, and (C) TDS spectra for the BLM and PARP3 PQSs, as well as the (D) Tm and (E) thioflavin-T fluorescence intensities for all PQSs with comparisons to a known G4, dsDNA, and ssDNA controls. Data for all of the sequences are provided in Figure S1. *These sequences failed to provide thermal transitions while monitoring at 295 nm. The 1H-NMR, CD, and Tm data for the NTHL1 PQS were reported in our previous work.13

