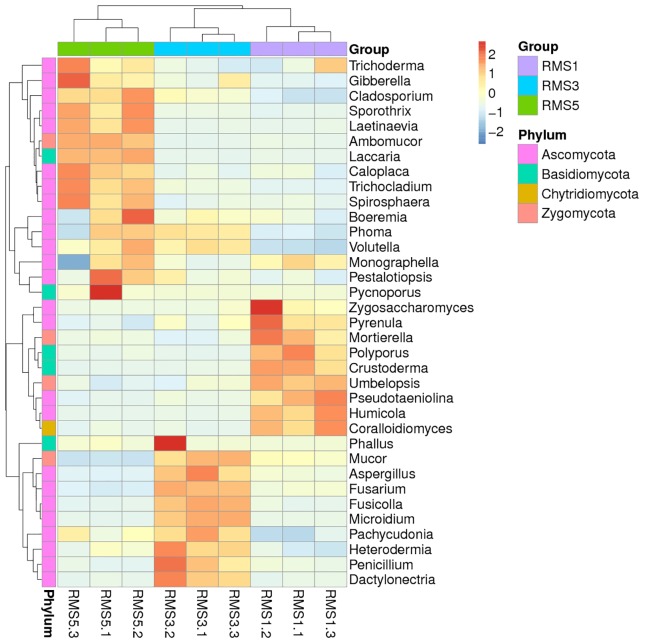
Fig 3. Distribution of the 35 most abundant fungal genera among the three C. chinensis rhizosphere soil samples.
Samples are listed on the Y-axis and fungi species on the X-axis. For the heat map, the left side of the cluster tree is the species cluster tree and the above cluster tree is a sample cluster tree. The mediate heat map represents the Z value of each line, which was calculated as the difference in the average relative abundances of fungi genera from all samples divided by their standard deviations.

