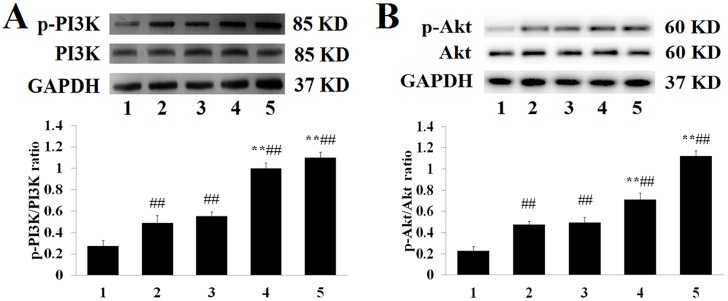
Fig 7.
(A): p-Akt, Akt and GAPDH expression levels in in the myocardial tissue of each group. (1: Sham, 2: MIRI, 3: L-tilianin, 4: M-tilianin, 5: H-tilianin) (##P<0.01, **P<0.01, n = 10). (B): p-PI3K, PI3K and GAPDH expression levels in in the myocardial tissue of each group. (1: Sham, 2: MIRI, 3: L-tilianin, 4: M-tilianin, 5: H-tilianin) (##P<0.01 vs. the Sham group; **P<0.01 vs. the MIRI group, n = 10).

