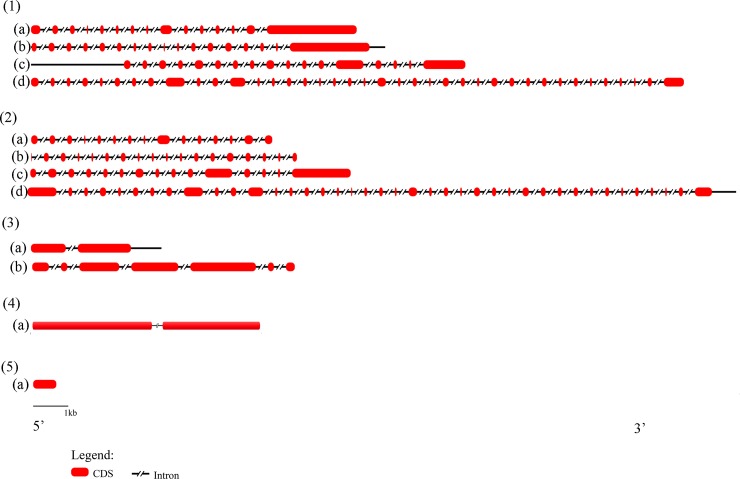
Fig 4. Gene structure of EIF2AKs.
Figure showing number of introns and exons of EIF2AK genes. (1)(a) to (1)(d) show intron exon map of EIF2AK1, EIF2AK2, EIF2AK3 and EIF2AK4 of Homo sapiens with exon numbers 15, 17, 17, 39. Similarly (2)(a) to (2)(d) show intron exon map of Xenopus tropicalis’ EIF2AK1, EIF2AK2, EIF2AK3 and EIF2AK4 with 15, 18, 15 and 40 exons. 3 (a), (3)(b) show intron exon maps of Musca domestica’s EIF2AK3, EIF2AK4 with a fewer exons 2 and 7. (4)(a) shows gene structure of Saccharomyces cerevisiae with two exons. (5)(a) shows gene structure of STPK from Bacillus subtilis with single exon. Legend shows the representation of CDS and intronic regions.

