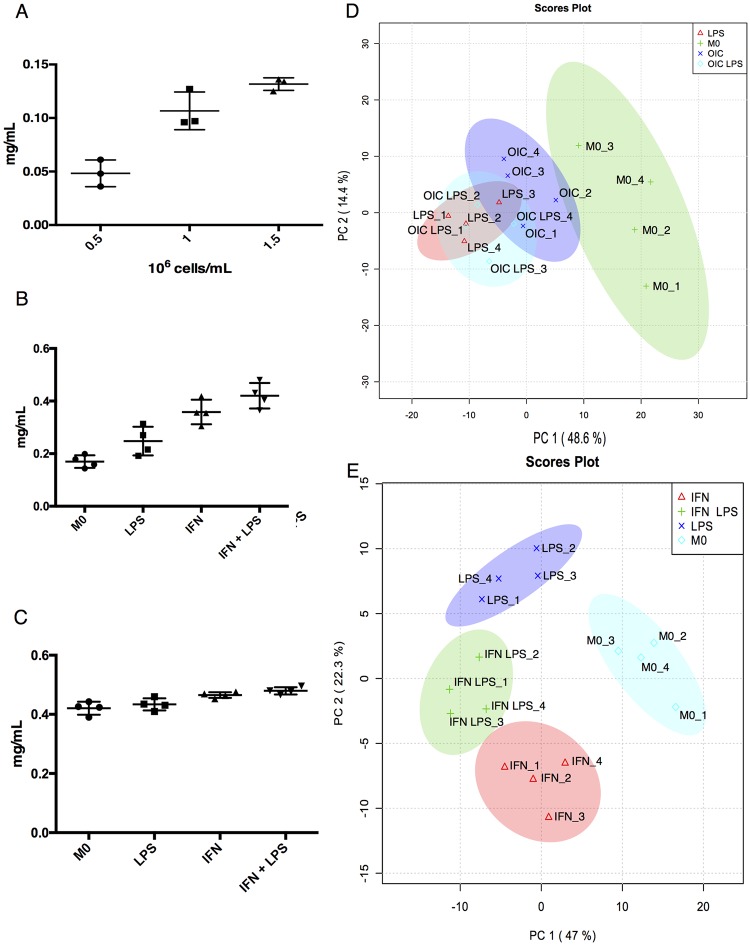
Fig 1. Method of quantifying protein content (mg/mL) post extraction.
(A): Macrophages were seeded at densities indicated (n = 4) and protein content quantified post extraction. Results are representative of two independent experiments. (B): The same protocol was employed post extraction on cells cultured using a standard protocol (n = 4). Two sample groups were primed with IFNγ (100 U/mL) overnight, then LPS (100 ng/mL) for 4h (IFN LPS) while the other sample did not get LPS (IFN). One group of samples was treated with LPS without prior IFNγ stimulation (LPS) while M0 is non-treated. The cells that did not receive a given stimulus received an equal volume of cRPMI. (C) As in B, protein quantification was carried out post extraction on samples (n = 4) that were prepared using the modified culturing protocol. Stimuli use and duration were as used in B. (D) PCA on anti-inflammatory (Dataset 1, n = 4) and (E) inflammatory (Dataset 2, n = 4) macrophage data. For D, either LPS (100 nG/mL), ovalbumin-immunoglobulin immune complexes (OIC) (136.4 μg anti ova:13.63 μg albumin), or both were added for six hours. For E, culture conditions and stimuli treatment were as used in C. Note that C is the actual protein measurements of the samples in E. Data was log transformed prior to analysis. MetaboAnalyst 3.0, which utilises the pcaMethods Bioconducter package [17] was used to construct PCA plots. 95% confidence intervals are highlighted by the respective background colour.

