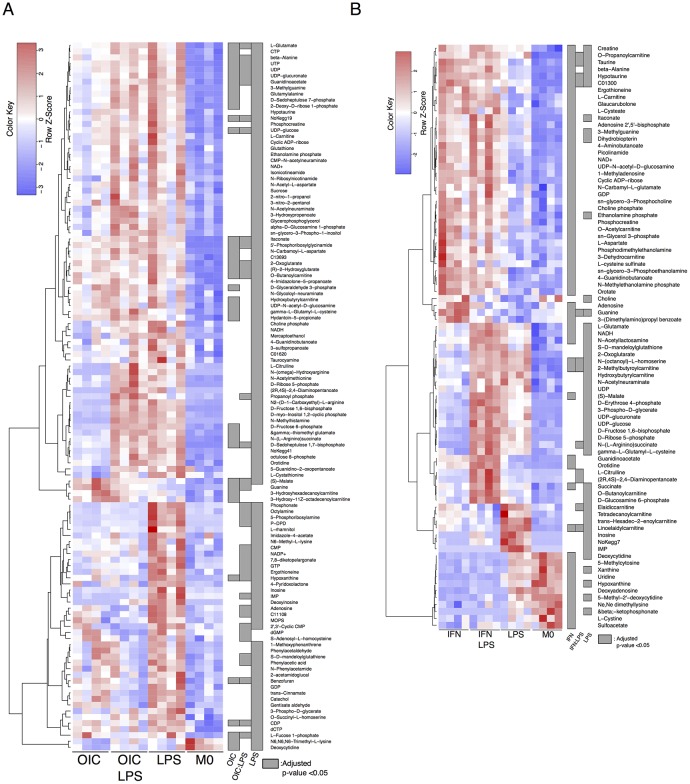
Fig 3. Heatmaps showing metabolites with significantly (GLM FDR < 0.05) altered levels.
Treatment groups are as indicated (n = 4 for both 3a and 3b). For the “Significance” grey refers to GLM corrected p-value (FDR< 0.05). Dataset 1 (anti-inflammatory, Fig 1D) is shown in the first heatmap and Dataset 2 (inflammatory set, Fig 1E) in the second.

