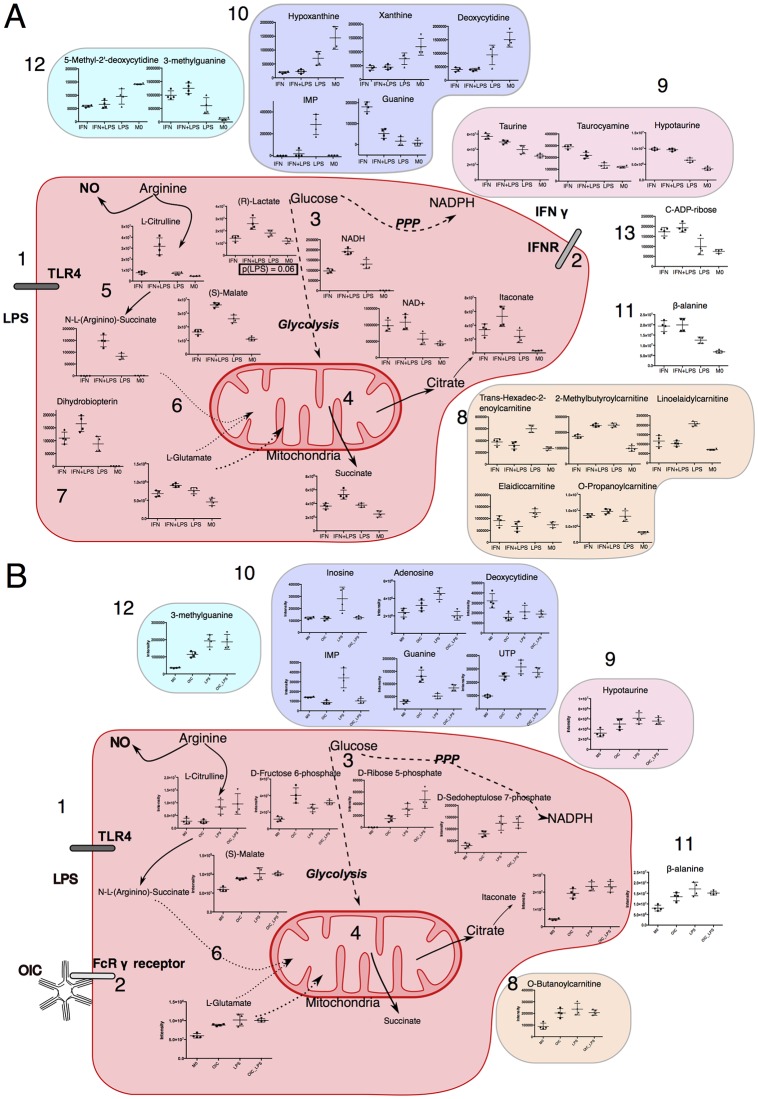
Fig 4. Our results on (A) inflammatory macrophages and (B) anti-inflammatory macrophages in the context of macrophage immune-metabolism.
Note that location of metabolites does not refer to cellular location. 1: & 2: Stimuli (LPS and IFNγ) were used as described in Fig 1. 3: This causes increase in metabolites in glycolysis ((R))-Lactate) and the PPP (S4 File). 4: Previously reported perturbations in the TCA cycle are indicated including Itaconate production and Succinate accumulation. 5: L-Arginine is metabolised to L-Citrulline and effector molecule NO*. 6: Arginine and Glutamate metabolism are connected with N-L- (Arginino)-Succinate and aspartate (from glutamate) allow for replenishment of the TCA cycle at the point of Fumarate. 7: Dihydrobiopterin is used to form the iNOS cofactor tetrahydrobiopterin by Dihydrobiopterin reductase. 8: Levels of select carnitine related metabolites are modulated by LPS and/or IFNγ. 9: Taurine metabolism is modulated by IFNγ. 10: Purine and pyrimidine metabolism displays as stimuli specific profile as did some modified analogues. 11: Levels of β-alanine, which can originate from arginine, pyrimidine fatty acid or glutamate metabolism, were increased in inflammatory macrophage. 12: alterations in nucleotide analogues were present in both datasets. 13: C-ADP-ribose in increased in an IFNγ dependent manner. For colour schemes, blue refers to nucleotide analogues, purple to purine and pyrimidine metabolism; orange to carnitine related metabolites; red refers to central carbon and arginine metabolism; and pink refers to taurine metabolism. Differences in metabolites present in each A and B is due to a lack of significant changes or metabolite not being detected. Direct reactions are in bold lines; dashed lines show multistep reactions.

