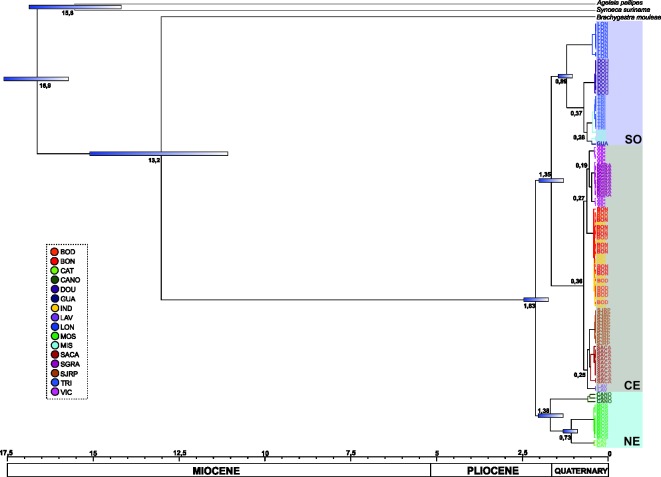
Fig 6. Chronogram with divergence times.
Colors of the clades correspond to those of the haplotype network. Numbers annotated on each node represent the divergence times between clades, and the standard deviations (95% of high posterior density) are represented by the blue bars (divergence times less than 100 kaand intervals shorter than 500 ka are not represented). Acronyms shown in Table 1.

