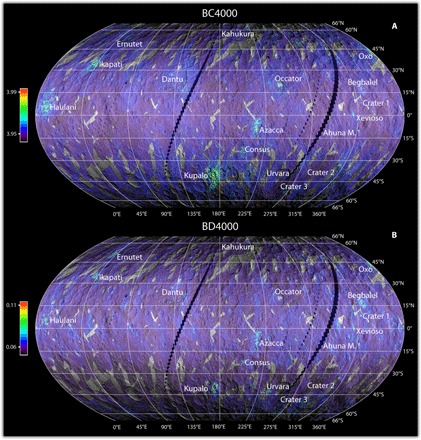
Fig. 1. Distribution and intensity of the carbonate absorption in VIR data.

(A) Central wavelength and (B) intensities of the 3.9-μm absorption feature. The maps are superimposed on the Framing Camera images using a transparency of 25%.

(A) Central wavelength and (B) intensities of the 3.9-μm absorption feature. The maps are superimposed on the Framing Camera images using a transparency of 25%.