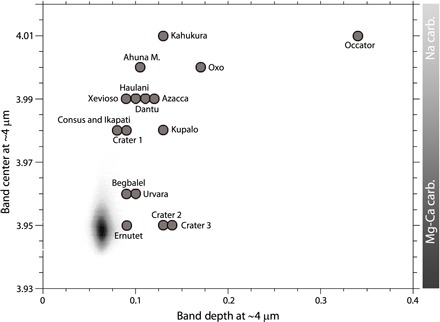
Fig. 4. Scatterplot of the band center versus band depth of the carbonate absorption.

The gray bar on the right indicates the relative regions where Mg-Ca carbonates (Mg-Ca carb.) and Na carbonates (Na carb.) are located. The gray cloud represents the data from the global map of Ceres’ surface as in Fig. 1.
