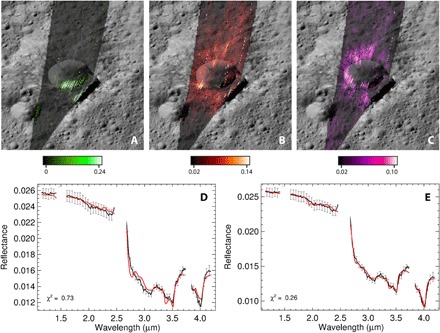
Fig. 5. Distribution of surface compounds in Oxo crater.

(A) Water ice, (B) Na2CO3, and (C) hydrated sodium carbonate (Na2CO3·H2ONa2CO3·H2O). Mass fraction abundances are derived from the spectral fitting method (table S2). The lower panels show the spectral fit (red curve) of select pixels in Oxo using (D) ammonium montmorillonite, dolomite, dark material, and natrite (Na2CO3) excluding and (E) including Na2CO3·H2O. Error bars are calculated according to calibration uncertainties and Poisson noise (41).
