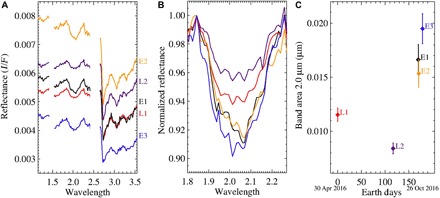
Fig. 2. Measured average spectra and their band area at 2.0 μm from the ice-rich region.

(A) Average spectra for each of the five observations from pixels in the rectangle of coordinates: latitude = [−35.0643, −34.7051] and longitude = [167.8362, 169.1599]. Spectral ranges corresponding to the instrument filter junctions are not shown. (B) Absorption band at 2.0 μm normalized at 1.83 μm. (C) Band area measured as a function of Earth days by setting the day of the first observation (L1) equal to 0.
