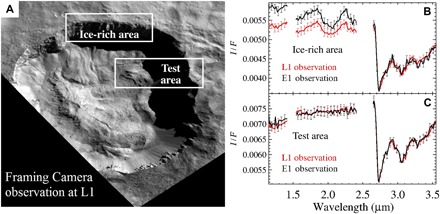
Fig. 3. Comparison of L1 and E1 observations in the ice-rich area and in a test area.

(A) Average spectra of pixels in the rectangle (latitude = [35.0643, −34.7051]; longitude = [167.8362, 169.1599]) are used as a reference to compare the five observations. Two measured spectra from L1 and E1 can be directly compared due to the equal viewing geometry and illumination conditions. (B) The increase of water ice signatures and continuum level is clearly visible. Error bars include Poissonian noise and calibration uncertainty. (C) Comparison of average spectra from a test area (latitude = [−35.714045, −35.292928]; longitude = [168.6245, 169.8397]) does not show any significant variation.
