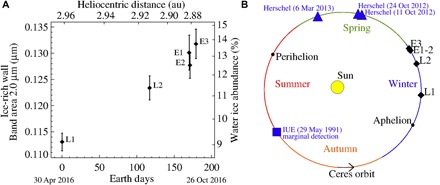
Fig. 4. Modeled increase of water ice on the crater wall and contextualization along Ceres’ orbit.

(A) Left axis: Band area at 2.0 μm calculated after isolation of the signal of the ice-rich wall by removal of the outer signal from average spectrum. Right axis: Water ice abundance as retrieved by the model (table S2). Both quantities are shown as a function of Earth days by setting the day of the first observation (L1) equal to 0. Error bars are estimated as discussed in the Supplementary Materials. au, astronomical unit. (B) Ceres orbit with International Ultraviolet Explorer (IUE) and Herschel water detections (12, 13). The orbit segment associated with the Juling observations indicates an increasing solar flux in the southern hemisphere of Ceres, where Juling is located.
