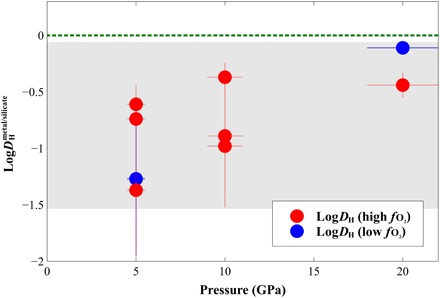
Fig. 3. Hydrogen partitioning between metal and silicate () as a function of experimental pressure.

Red and blue circles represent experiments performed at oxygen fugacities above IW-2 and below IW-3.5, respectively. The green dashed line at = 0 indicates the limit between lithophile (below) and siderophile behavior (above). The gray area encompasses the range of DH values determined from our experiments, all of which indicate lithophile behavior.
