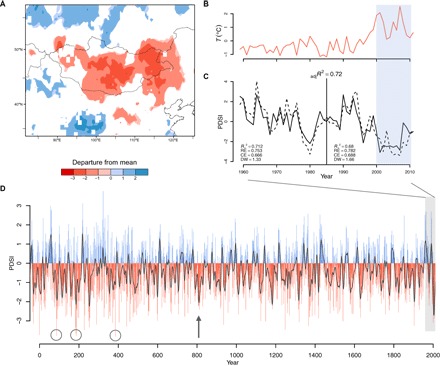
Fig. 1. The 21st-century drought.

(A) Self-calibrating Palmer Drought Severity Index (PDSI) anomalies across Asia (2000–2010 and 1959–2011 reference periods) (24). (B) Observed temperature anomalies (NASA Goddard Institute for Space Studies) (42) over Mongolia (1959–2011 reference period). (C) Reconstructed (black) and observed (dashed) PDSI with 2000–2010 drought highlighted (blue bar), and split calibration/verification period (vertical line) statistics including verification R2 (Rv2), reduction of error (RE), coefficient of efficiency (CE), Durbin-Watson statistic (DW), and overall adjR2 for entire calibration period. (D) Reconstructed PDSI (49 BCE–2011 CE). Shown are blue (PDSI > 0) and red (PDSI < 0) bars with a 15-year spline (black line) centered on the mean of the calibration period (1959–2011). More severe single-year droughts (86, 186, and 385 CE) are marked with open circles, and the severe drought beginning in 804 CE is indicated with an arrow.
