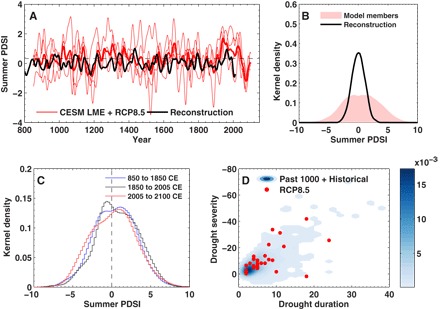
Fig. 3. Past, present, and future drought in paleoclimate reconstructions and Community Earth System Model (CESM) model simulations.

(A) CESM Last Millennium Ensemble (LME)–simulated (red) and tree ring reconstructed (black) Penman-Monteith PDSI for Central Mongolia. Thin red lines are individual ensemble members from CESM LME that have an extension to 2100 using the Representative Concentration Pathway 8.5 (RCP8.5) scenario. The heavy red line is the ensemble mean. All time series have been smoothed with a 30-year Gaussian filter. (B) Kernel probability density estimate for the individual ensemble member simulated and the tree ring reconstructed annual PDSI values used in (A). (C) Kernel probability density estimates for the CESM LME model simulated PDSI for three periods: the last millennium (850–1850), historical (1850–2005), and future RCP8.5 (2005–2100), showing an increased occurrence of the most severe annual drought index values under the future greenhouse gas forcing scenario. (D) Bivariate kernel density of joint drought duration and severity from the CESM LME ensemble for multiyear (2 years or more) events. Blue shading shows the joint distribution for the model last millennium and historical periods, whereas red circles indicate multiyear drought events under the future RCP8.5 forcing.
