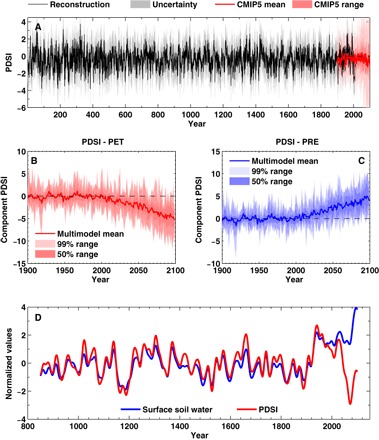
Fig. 4. Uncertainties in future moisture projections.

(A) Reconstructed (black) and Coupled Model Intercomparison Project Phase 5 (CMIP5)–simulated (red) PDSI. Gray shading around the reconstruction indicates uncertainty as the root mean square error of the reconstruction. Pink shading around the CMIP5 ensemble mean (red line) shows the two-tailed 99% range estimated from all individual ensemble members. (B) CMIP5-simulated PDSI–potential evapotranspiration (PET) calculated using detrended precipitation values over 2000 to 2099. (C) CMIP5-simulated PDSI precipitation (PRE) using detrended temperature, net radiation, and vapor pressure over 2000 to 2099. (D) CESM LME ensemble mean calculated PDSI (red line) compared to online simulated CESM land surface model near-surface soil moisture (blue). Both time series have been smoothed using a 30-year Gaussian filter.
