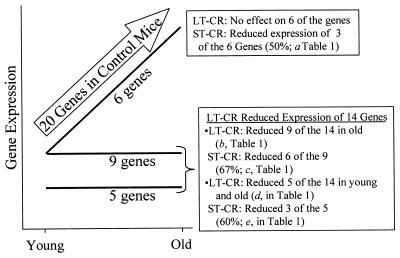
Figure 1.
LT- and ST-CR effects on the expression profile of 20 liver genes whose expression increases with age (arrow). LT-CR opposed the age-associated increase in the expression of 14 genes, in the manner shown by the lines labeled “9 genes” and “5 genes.” For the 9 genes, LT-CR returned expression to youthful levels in old mice. For the 5 genes, LT-CR reduced expression in both young and old mice. LT-CR had no effect on the expression of 6 of the 20 genes (line labeled “6 genes”). These genes are identified by the notation “NE” in Table 1. The effects of ST-CR are described in the text boxes.

