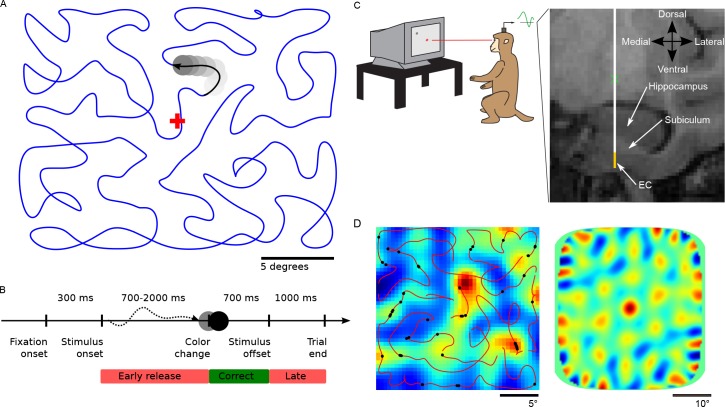
Figure 1. Task design and recording location.
(A) Monkeys were trained to maintain central fixation while a dot moved across the screen and were rewarded for releasing a response bar when they detected a color change of the moving dot. Dot trajectories were smoothed Hamiltonian cycles through a 23 × 23 grid and covered the screen without a central bias. The blue trajectory was not shown during the experiment. (B) Temporal structure of a trial. (C) Recording setup and example of MRI-guided electrode placement (coronal section through the EC). Recordings were carried out with a 12-site laminar electrode array mounted on a tungsten microelectrode (AXIAL Array, 30 μm diameter, 150 μm spacing, FHC Inc.). Tungsten electrode is represented in white, the yellow strip represents the span of the recording contacts. EC = Entorhinal Cortex. (D) Example cell recorded under conditions of covert attention. Left panel shows the estimated firing field (max. firing rate 1.47 Hz). The small black dots on the trajectory indicate the spikes recorded during the first cycle. They largely align with the average firing field (backdrop) based on all six cycles recorded for this neuron. The 2D autocorrelation in the right panel shows six peaks surrounding the center which is characteristic of grid cells (gridness score 1.80).

