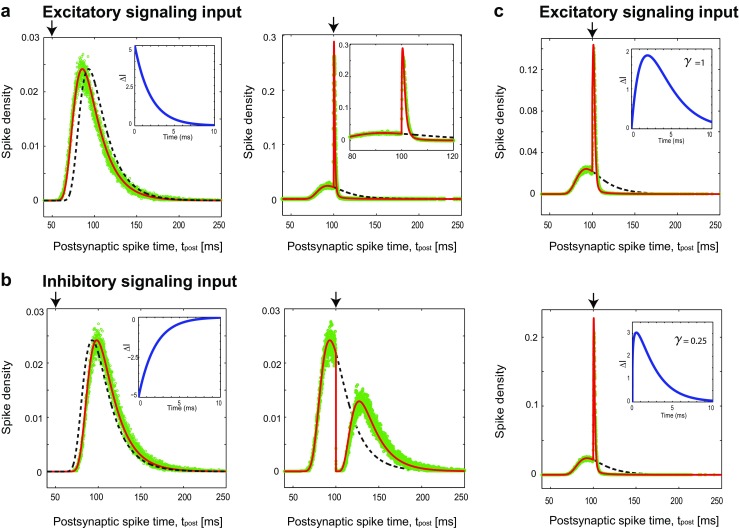
Fig. 5.

First-passage time density when the neuron receives exponential decaying signaling input and background noise at the threshold regime. The black vertical arrows show when the signaling input arrives; it changes the initial ISI distribution, shown in dashed black curve, to the modified distribution, thick red curve. Even when the signaling input is remarkably strong, the analytic modified distribution well matches the simulation results, which come as empty green circles. a Left: An early excitatory signaling input at t∗ = 50 mscauses a leftward temporal shift. The result is very similar to the case of square input (Fig. 2a, left). Right: A drastic change occurs, if the signaling input arrives at t∗ = 100 ms, close enough to the peak of initial spiking density. The change in density is smoother comparing with Fig. 2a, right. The inset shows the shape of the signaling input. b Left: An inhibitory signaling input imposes a mere temporal shift, a delay, if it occurs too early, t∗ = 50 ms. Right: If the inhibitory signaling input occurs close enough to the peak, , the spiking density almost divides into two distinct regions. The inset shows the shape of the signaling input. c The first-passage time density for the cases that signaling input is gamma function with parameter γ = 1(Top) and γ = 0.25(Bottom). The values of the parameters are chosen using the physiologically plausible range (McCormick et al. 1985). Here, we use membrane time constant τm = 20 ms, τs = 2 ms, A = 10 mV ms, threshold voltage of V𝜃 = 20 mV, diffusion coefficient of D = 0.74 mV2msand the simulation time step is Δt = 0.05 ms
