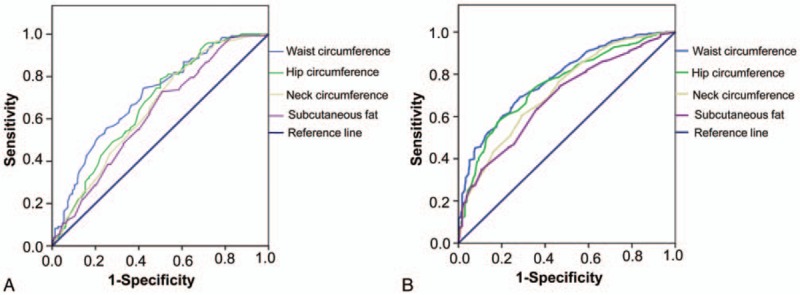
Figure 1.

ROC curve of obesity indexes. ROC curve was used to analyze the predictive value of obesity indexes in the incidence of NAFLD in female and male. (A) ROC curve in male. Area under the curve of waist circumference, hip circumference, subcutaneous fat, and neck circumference in male were 0.711, 0.668, 0.652, and 0.649, respectively. (B) ROC curve in female. Area under the curve of waist circumference, hip circumference, subcutaneous fat, and neck circumference in female were 0.790, 0.760, 0.697, and 0.710, respectively. NAFLD = nonalcoholic fatty liver disease, ROC = receiver operating characteristic.
