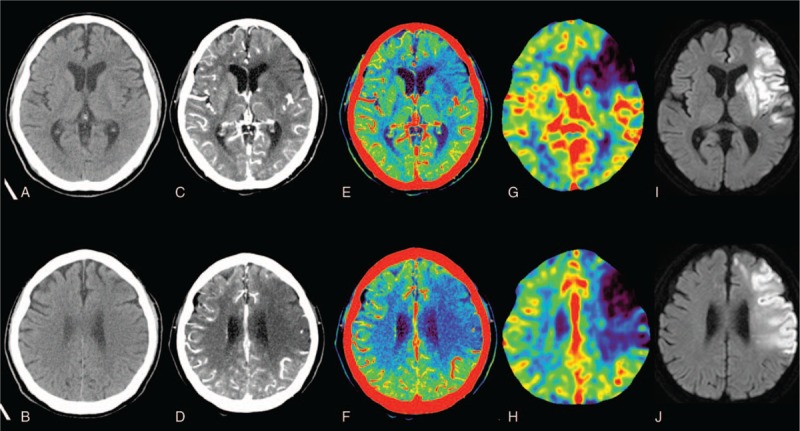
Figure 4.

Onset NCCT (A, B), tMIP-gray (C, D), tMIP-color (E, F), CTP-CBV (G, H), and follow-up DWI (I, J) in representative patients with acute cerebral infarction caused by left ICA occlusion. This NCCT image is almost normal. However, the tMIP-gray and tMIP-color images clearly show low attenuation and avascular area in the left frontal-parietal lobe and basal ganglia, which correspond to low CTP-CBV areas. Follow-up DWI showed low-intensity area in the same location in which the onset NCCT shows EIC. CBV = cerebral blood volume, CTP = CT perfusion, DWI = diffusion weighted image, EIC = early ischemic change, ICA = internal carotid artery, NCCT = noncontrast computed tomography, tMIP = time maximum intensity projection CT technique.
