
Figure 1. Generation and Characterization of GSK3 Mutant ESC Lines.
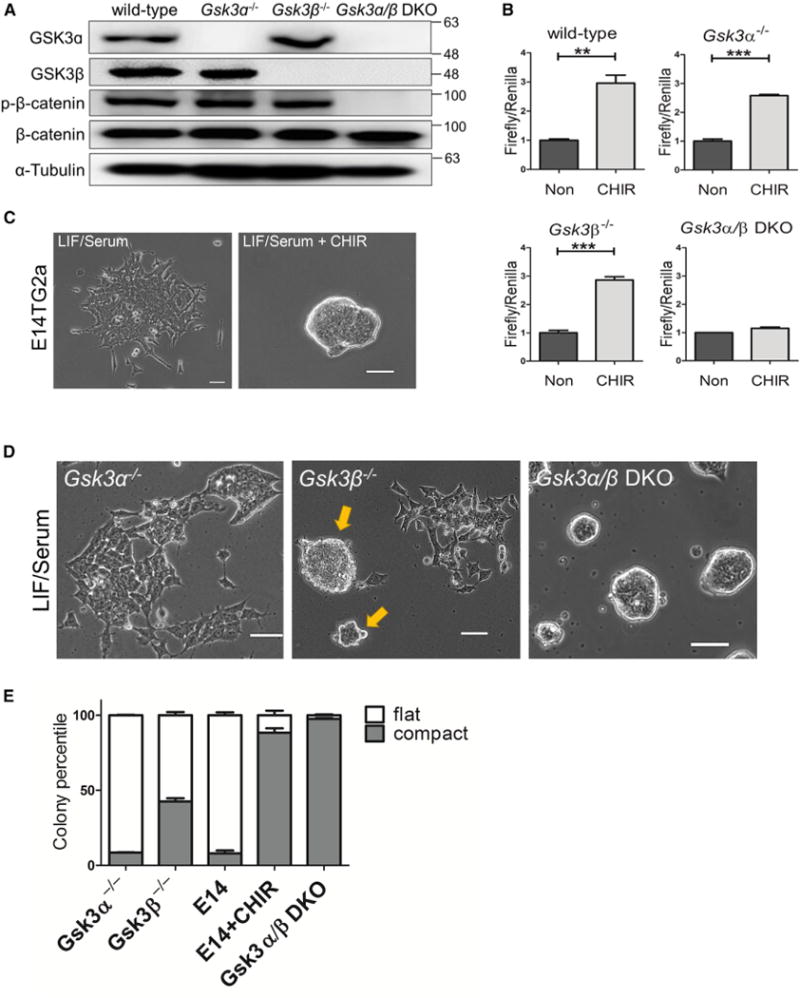
(A) Western blot analysis of Gsk3α−/−, Gsk3β−/−, and Gsk3α/β DKO ESCs. Gsk3α/β DKO ESCs were generated by knocking out Gsk3α in Gsk3β−/− ESCs. β-Catenin phosphorylation at S33/S37/T41 was examined in the indicated ESC lines using a phospho-β-catenin antibody from Cell Signaling Technology (no. 9561, lot 12). The same antibody was used to examine phosphor-β-catenin throughout the study.
(B) TopFlash assay in wild-type and GSK3 mutant ESCs treated with 3 μM CHIR for 8 hr. Non, no treatment control. Data represent means ± SD of three biological replicates. **p < 0.01; ***p < 0.001.
(C) Representative images of E14TG2a ESCs cultured in LIF/serum or LIF/serum + 3 μM CHIR for 5 days. Scale bars, 100 μm.
(D) Representative images of different GSK3 mutant ESC lines cultured in LIF/serum for 5 days. Gsk3β−/− ESCs formed both compact (arrows) and flat colonies. Scale bars, 100 μm.
(E) Quantification of flat and compact colonies formed from the indicated ESC lines. ESCs were plated onto six-well plates at clonal density and cultured in LIF/serum (if not specified) or LIF/serum + 3 μM CHIR (E14 + CHIR) for 7 days. E14, E14TG2a ESCs. Data represent means ± SD of three biological replicates.