
Figure 2. Characterization of GSK3 Mutant ESCs Cultured under Serum-Free N2B27 Condition.
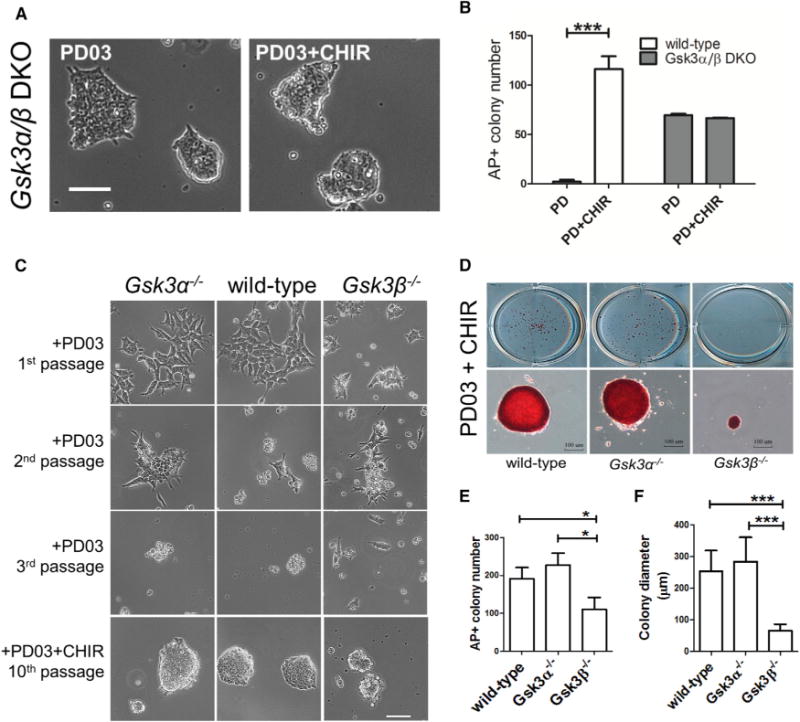
(A) Representative images of Gsk3α/β DKO ESCs cultured in the indicated conditions for five passages. Scale bar, 100 μm.
(B) Quantification of alkaline phosphatase positive (AP+) colonies formed from wild-type and Gsk3α/β DKO ESCs cultured in N2B27 medium supplemented with PD03 or PD03 + CHIR. ESCs were plated onto 12-well plates at a density of 200 cells/well and cultured in the indicated conditions for 7 days before performing AP staining. AP+ is an indicator of undifferentiated ESCs. Data represent means ± SD of three biological replicates. ***p < 0.001.
(C) Representative images of wild-type and GSK3 mutant ESCs cultured in N2B27 medium supplemented with the indicated inhibitors. Scale bar, 100 μm.
(D) Representative images of AP+ colonies formed from the indicated ESC lines cultured in PD03 + CHIR for 7 days. ESCs were plated onto 12-well plates at a density of 500 cells/well and cultured in PD03 + CHIR/N2B27 for 7 days. Scale bars, 100 μm.
(E) Quantification of the numbers of AP+ colonies formed from the indicated ESC lines as shown in (D). For each ESC line, the AP+ colony data represent means ± SD from a total of nine wells in three independent experiments. *p < 0.05.
(F) Quantification of the diameters of AP+ colonies formed from the indicated ESC lines as shown in (D). The diameter of the AP+ colonies was calculated using the image software AxioVision. For each ESC line, the colony diameter data represent means ± SD from a total of 60 randomly selected AP+ colonies. ***p < 0.001.