Abstract
To fulfill the requirement of sample preparation in a microfluidic analysis system designed for “sample in, answer out” testing which was urgently needed by resource limited clinical facilities, we proposed a critical low cost, membrane-based serum separator design in this article. With a specially designed microchip, this device can easily separate serum from the whole blood sample in 5 min. Different from techniques which have been reported earlier, this approach does not require either centrifugation or sample dilution which may cause hemolysis or decreased testing sensitivity. By applying 300 μl of the whole blood sample, 50–70 μl of serum can be recovered from each device, and the serum volume recovery rate compared with centrifuged control is around 73% which is sufficient for most of the microfluidic-based assays. The protein recovery rate ranged from 70% to 95% which was compared with centrifuged control. The evaluation results indicate that this sample preparation device can offer sufficient amount of purified serum sample for any kind of diagnostic assays such as immunoassay and serum nucleic acid assay.
I. INTRODUCTION
With the development of microfluidics technique, Point of Care Testing (POCT) which is based on a Micro-Total Analysis System (μTAS) is becoming more and more widely used for patient diagnosis, therapy monitoring, physical examination and healthy management. Although POCT testing has been used for the detection of certain analytes such as glucose, Human Chorionic Gonadotropin and antigen, there are still many analytes which cannot be tested by using the whole blood sample directly due to the serious sample matrix effect. Because of this situation, serum separation is needed before testing.
Nowadays, routine whole blood separation relies on the low speed centrifugation technique which served as a gold standard for blood sample pretreatment around the world for decades; however this widely used serum purification method has its own disadvantages. Centrifugation needs a centrifuge and this requirement introduced extra budget and space cost. It also needs sample transportation from the centrifuge to the testing instrument and errors may occur due to barcode error or operation bias in this process. Centrifugation may lead to sample hemolysis that will make the sample unsuitable for medical analysis. On the other hand, a centrifuge can only process one group of samples at the same time. It is impossible to handle new samples while the latest one is still under centrifugation. This drawback has also limited its application in POCT because of the lack of ability to walk-in-and-test. Lastly, it is too large to integrate into a μTAS and achieve a “sample in, answer out” assay mode for the whole blood sample. New techniques for separating serum or plasma from the whole blood sample with high efficiency and purity are urgently needed to break the bottleneck for μTAS development and clinical applications.1,2
Currently, there are two major categories for serum preparation based on μTAS—passive separation and active separation. Distinguished from the active separation technique, the passive method does not require any external equipment or devices to help the separation process. It mostly relies on the physical characteristics of samples itself,2 such as cell size, deformation, viscosity, particle inertia and sedimentation rate. Without any extra forces and manipulation, the passive separation can be finished depending on the well-designed micro-channel,3–8 pillar array9–17 or implanted filtration membrane18–22 in certain microfluidic chips; however, these approaches have their own problems, too. For example, aggregated erythrocytes will clog the pores very quickly and lead to decreasing separation efficiency when applying size selection filtration; crossflow separation requires a higher volume of sample to achieve the same amount of serum compared with centrifugation due to the principle characteristics; Zweifach-Fung effect driven separation requires critically low hematocrit (HCT), so sample dilution is needed before separation.23–26 These drawbacks limit the application of μTAS in POCT, for which sample pretreatment is required.
Membrane based whole blood separation has already been investigated for years. Although progress has been made and this method is more applicable compared to its original design, it still has so many problems such as erythrocyte clogging, high filtration pressure requirement, and slow flow rate. All of these disadvantages were caused by the small size of the membrane pore which is normally 0.4–0.8 μm in diameter.21,22 The simplest way to overcome all of the previously described disadvantages is to increase the pore size, but this will directly lead to insufficient separation efficiency and decreased serum purity. There are two approaches to resolve this problem; the first one it to aggregate erythrocytes and make them become too large to filter out with serum and the second one is to capture erythrocytes on the membrane while the separator is working.2
Cold agglutinin is a group of antibodies—normally IgM—which was first described in 1957 and which that consists of anti-A, anti-B, anti-Le, anti-Tj, and the Donath-Landsteiner antibody of paroxysmal cold haemoglobinuria.27 Cold agglutinin can cause agglutination in saline and also render cells susceptible to agglutination by antiglobulin serum. By using a cold agglutinin coated glass fiber membrane (GFM), the erythrocytes will be captured by immobilized anti-Red Blood Cells (RBC), while the serum flows directly to the end of the GFM. By simply applying a negative pressure on the serum area, the separated serum can be easily collected.
In this article, we introduce a new method for on-chip whole blood separation. This method involves a glass fiber membrane (GFM) based modular design, is of critically low-cost, easy to fabricate and use, and provides a high yield rate and high protein recovery, which can also be easily integrated into the existing POCT chip as a reliable whole blood sample preparation modular. This approach is an ideal solution for sample preparation in a serum analyzing microfluidic platform.
II. MATERIALS AND METHOD
A. Sample preparation and handling
Blood samples were collected from the National Institute of Diagnostic and Vaccines Development in Infectious Diseases (NIDVD) at Xiamen University. The heparin pretreated blood sample tube (BD, USA) was used to prevent any coagulation. All samples were collected and tested freshly; no preserved sample was used in this research.
B. Anti-RBC coated GFM preparation
The coated GFM was prepared by following the instructions of the manufacturer (Beijing Wantai BioPharm, China). In short, 1 ml of diluted anti-RBC was added onto the GFM which has been cut into 2 × 10 cm size, followed by 6 h of incubation under 4 °C. The incubated GFM was then transported to a −80 °C refrigerator for pre-freezing before lyophilization. After overnight lyophilization, the coated GFM was cut into 2 × 2 cm for further evaluation and stored at room temperature.
C. Device fabrication
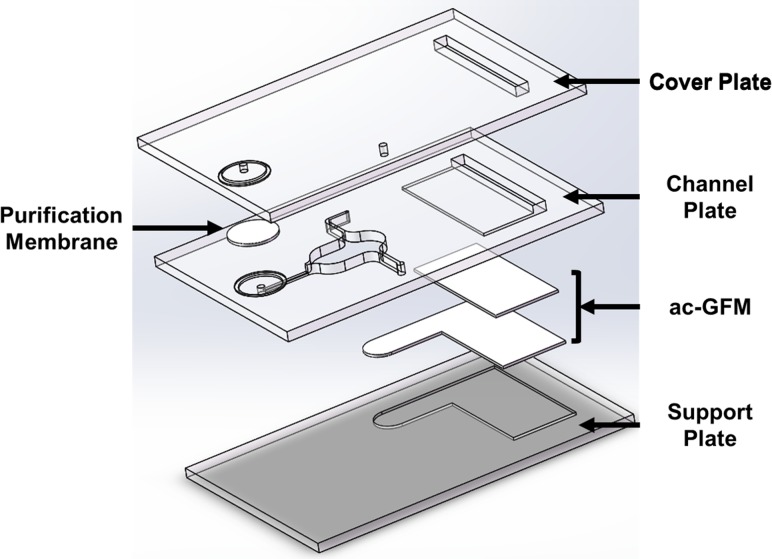
A standard laser (SI-30Ti, Spirit, China) cut PMMA was used and a double tape fabrication technique was applied to fabricate the device. In short, PMMA (Oudifu, China) coated with double tape (SDK, China) on one side was cut by a laser cutter according to the design, then the chip was sealed by the tape and bonding was reinforced by heat pressing. Figure 1 shows the diagram for device fabrication.
FIG. 1.
Magnified diagram of the device.
D. Evaluation
1. Erythrocyte migration rate
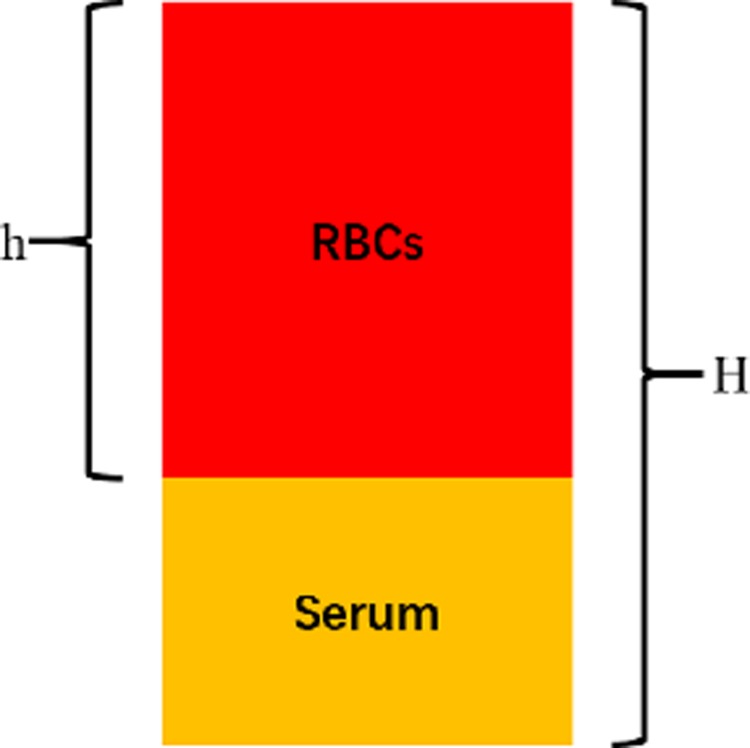
Erythrocyte migration rate (EMR) is a parameter which was used to evaluate the capability of the GFM to capture the RBCs. The faster and stronger the antibody captured the cells, the shorter the distance the cells moved forward in the GFM. This parameter was calculated simply by using the formula below. Here, h is the RBC moving distance and H is the total length of the GFM pad (Fig. 2):
| (1) |
FIG. 2.
EMR calculation method.
2. Volume recovery evaluation
Because of the inner volume of the GFM, the chip cannot separate all serum from the raw sample. In order to evaluate the serum recovery efficiency, we introduced the volume recovery rate as an evaluation criterion for separation efficiency. The volume recovery rate was defined as the rate at which serum was separated from a chip/ac-GFM compared with the serum separated by centrifugation by using the same blood sample. This parameter was calculated by using the following formula:
| (2) |
3. Residual cell verification
Residual cell verification was calculated to evaluate the capability of the chip in removing RBCs from the whole blood sample. This parameter was calculated by using the following formula:
| (3) |
While the cells were counted with a common blood cell analyzer (BC-5300VET, Mindray, China) for centrifuged control and the chip purified serum, respectively.
4. Protein recovery evaluation
We use serum ferritin as a marker to evaluate the protein recovery of the separation device. A commercialized ferritin testing kit (Beijing Wantai BioPharm, China) was used to test ferritin in serum samples collected from chips and centrifuging control following manufacturer's instructions. For a brief description, 20 μl of the serum sample was mixed and incubated at 37 °C for 15 min with 50 μl of antibody coated magnet particles, followed by 3 times washing. 50 μl of acridinium ester labeled antibody was applied and incubated for 10 min. After 4 washes, pre-stimulated and stimulated reagent was added and the light signal was collected in 3 s. The results obtained from the chip recovered serum sample was compared with centrifuged control to learn if there is any protein adsorption onto GFM and the chip device.
III. RESULTS
A. Anti-RBC coating ladder
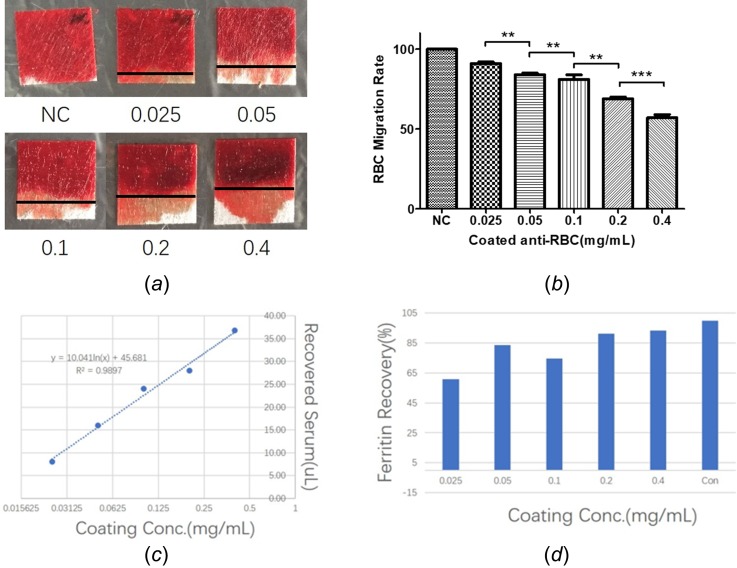
The serum recovery ability of this method is correlated with the capability of the modified GFM to capture RBCs in a sample. The RBC capturing ability of the GFM can be different in GFM coated with different anti-RBC concentrations. To optimize the serum recovery, we tested a concentration ladder for anti-RBC, which has been coated on GFM. We tested 0.025 mg/ml, 0.05 mg/ml, 0.1 mg/ml, 0.2 mg/ml and 0.4 mg/ml of anti-RBC coating concentrations. The coated GFM was prepared by following the instructions of the manufacturer which are described in Sec. II B. The modified GFM was cut into a 2 × 2 cm GFM pad, and 150 μl of whole blood sample was applied to evaluate the separation performance in GFM with different anti-RBC concentrations. The serum sample used for serum recovery and protein recovery evaluation correlated with antibody coating ladder in this section was collected directly from the serum region of the GFM pad—which is shown in Fig. 3(a)—by pipetting.
FIG. 3.
Results for coating ladder evaluation. (a) Photographs showing the migration distance for erythrocytes. (b) Calculated erythrocyte migration rate. (c) Linear regression for coating antibody concentration and collected serum. (d) The recovery rate for ferritin in different antibody coating ladders. 10 parallel testing pads for each coating concentration were evaluated. (The experiment was performed twice to confirm the result, and each repeat consists of 5 parallels in each coating concentration.)
The EMR is 90%, 85%, 75%, 70%, and 60% for different anti-RBC coated concentrations, respectively [Figs. 3(a) and 3(b)]. The serum recovery was evaluated by measuring the serum volume from 5 tested GFM for each coated concentration, respectively, followed by a linear regression analysis which shows a R2 of 0.9897 [Fig. 3(c)]. We also chose ferritin as the marker to evaluate the protein recovery of different coated GFM. The recovered ferritin for 0.025–0.4 mg/ml was 60.6%, 83.7%, 74.6%, 91.2% and 93.2% compared with centrifuged control, respectively. This presented an increasing trend of recovered ferritin in the coated anti-RBC ladder that reached a plateau around 0.2 mg/mL [Fig. 3(d)].
B. Device design and operation
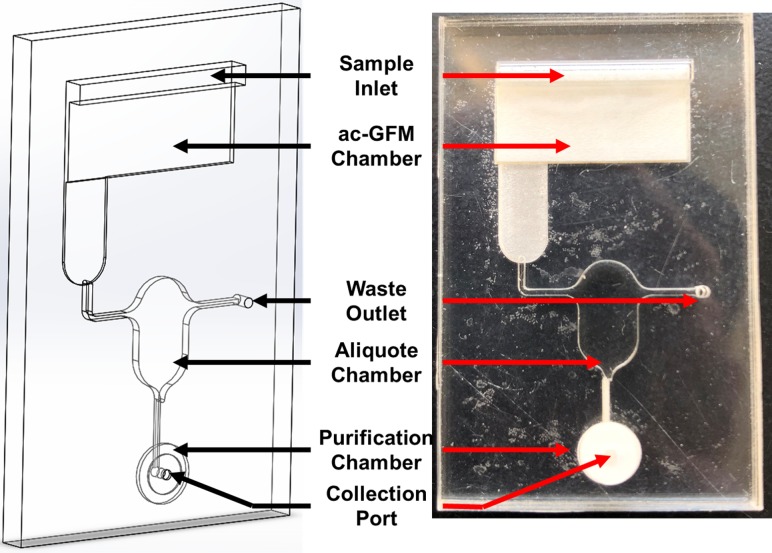
The chip consisted of three functions—separation, aliquoting and purification. As shown in Fig. 4, the chip was divided into three functioning zones from the top to the bottom. The top part of the chip is for serum separation, which served as a support for anti-RBC GFM. The middle part of the chip is the modular for sample aliquoting. This modular consisted of three channels and an aliquoting cup for sample measurement. The preliminary separated serum was delivered through the sampling channel and filled the measuring cup, while excess serum was transported to the waste chamber through the waste channel. Then, after closing the waste channel, the measured serum sample was transported to the purification modular which was located on the lowest part of the chip for further purification to yield residual cells by size selection (Pall™ Vivid™ GR Plasma Separation membrane, GE, USA) (Fig. 4).
FIG. 4.
Device design. Left: schematic view of the chip. Right: fabricated chip.
This chip was fabricated with two layers by previously described PMMA and double tape technique. 2 mm thick PMMA was cut and polished by the laser cutter that served as the chip chamber, ac-GFM was cut into the designed shape and immobilized in the chamber and sealed with a cover which consists of an inlet and an outlet.
To use the serum separator, collection port was closed first and 300 μl of whole blood sample was applied into the inlet evenly, followed by holding the chip in a vertical position with the outlet at the bottom side. The sample then slowly flowed through the ac-GFM, while erythrocytes were immobilized by coated anti-RBC, the preliminary separated serum flowed to the down-side sampling channel leading to the sample aliquoting chamber. The serum will slowly fill the measurement cup and the excess serum sample will flow to the waste outlet, to be discarded. Then the waste outlet was closed and the collection port was opened, a negative pressure was applied directly to the outlet that drove the serum sample flow out from the measuring chamber to the purification chamber (Fig. 5).
FIG. 5.
Operation process of the chip.
C. Serum recovery verification
300 μl of whole blood sample was applied to the chip and separated directly. Serum was collected as much as possible by applying negative pressure through a normal pipette. We successfully collected about 50–70 μl of clear serum from 8 testing chips, respectively. Compared with centrifuged controls, the serum recovery rate is around 76%. And, the residual cells after separation are 0%, 7.25% and 12.5% for RBCs, White Blood Cells (WBCs), and Platelets (PLTs), respectively.
D. Protein recovery verification
A standard curve has been set by testing a series of diluted (1:2) standard control, not only to calculate the analyte concentration of the sample but also to evaluate the performance characteristics of the ferritin kit.
Eight chips were fabricated and tested by using the same fresh whole blood sample. 300 μl of the blood sample was applied and 50–70 μl of serum specimen was collected. 20 μl of the collected serum was tested for ferritin to evaluate the protein recovery rate compared with the centrifuged sample which served as a positive control. The ferritin concentration for chip purified serum and centrifuged control is 264.7 ± 12.23 ng/ml and 350.7 ± 17.75 ng/ml, respectively. The protein recovery rate for the serum separation chip is 75.48% (Fig. 6).
FIG. 6.
Left: Standard curve for ferritin assay. Right: Ferritin recovery from chip purified serum and centrifuged serum. Each data point in the standard curve represents 2 tests in parallel. The “**” means P < 0.01, which indicates there is a significant difference in ferritin recovery between the chip separated serum and the centrifuge separated serum.
IV. DISCUSSION AND CONCLUSION
A. Anti-RBC coated ladder
Significant differences in RBC migration, serum recovery volume and protein recovery rate have been noticed at different anti-RBC coating concentrations. We observed that the RBC migration distance on a coated GFM decreased, while the coating antibody concentration increased. This was because the increasing coating concentration of anti-RBC enhanced the erythrocyte capture capability of the coated GFM and decreased the migration ability of the RBC on the ac-GFM. Interestingly, decreased RBC migration offered a higher serum recovery because of less RBC contamination which was due to an increased RBC affinity caused by higher coating anti-RBC concentration. We also noticed that the ferritin recovery showed an increasing trend until the anti-RBC coating concentration reaches 0.2 mg/ml. As shown in Fig. 3(d), there are no significant differences in ferritin recovery between 0.2 mg/ml and 0.4 mg/ml. It indicates that 0.2 mg/ml may be the threshold point for the anti-RBC coating concentration, and the ferritin recovery will not be increased significantly beyond this concentration.
B. Serum recovery
We successfully separated the whole blood sample with a sufficient serum volume recovery and cell exclusion by using the chip. As shown in Fig. 3(b), up to 93.2% of the serum was recovered by direct collection on the separation GFM, while only 76.85% serum has been collected by using the chip. This difference may be due to the inner volume of the chip chamber, and the GFM will hold certain amount of the serum. Although the recovery efficiency by using the separation chip is only 76.85%, we also collect about 60 μl of serum on average from 300 μl of raw sample, which is sufficient for most of the serum tests.
On the other hand, this chip has wonderful efficiency to remove RBCs from the whole blood sample. It removed almost 100% of RBCs from the sample after separation, and removed 92.75% and 87.50% of WBCs and PLTs, respectively. This may be because the antibody coated on GFM is anti-RBC, which can specifically capture and immobilize RBCs on the GFM. At the same time, a loose RBC clog matrix will be formed that serve as a filter to filtering WBCs and PLTs. But, due to its non-densification structure and nonspecific capturing of WBCs and PLTs, part of cells may still pass through the coated GFM and lead to a higher residual rate of WBCs and PLTs.
C. Protein recovery verification
As shown in Fig. 6, the chip only recovered 75.48% ferritin from the original sample compared with centrifuged control. That means the serum which has been collected from the chip contains less ferritin compared with the centrifuged sample. This result indicates that the chip may absorb proteins during the process. The chip consists of two parts—ac-GFM and a solid support for ac-GFM. According to the results in Fig. 5(d), the serum sample collected directly from ac-GFM coated with 0.2 mg/ml and 0.4 mg/ml anti-RBC recovered up to 93% ferritin from the raw sample. This result indicates that ac-GFM is not the main result for such low protein recovery in chip separation. This low recovery of protein may be caused by the hydrophilicity of the PMMA solid support. As shown in Fig. 7, a decrease in the contact angle of water from 98.1° to 62.8° has been observed on the surface of the PMMA plate, which proved that our laser cutting and engraving manipulation of the channel and the GFM chamber damaged the hydrophobic layer of the PMMA plate, the whole chamber and the channel turning into a hydrophilic interface. This hydrophilic interface absorbed ferritin while sample processing and caused the decreased ferritin recovery. This situation can be improved by using a molding technique to fabricate the chip or polish and rebuild the hydrophobic layer of the chip.
FIG. 7.
PMMA surface wettability before and after laser manipulation.
V. CONCLUSION
In this research, we have successfully developed an anti-RBC coated GFM based, gravity assisted, modular designed serum separation chip for further immunology or molecular biology assay. This chip can separate up to 300 μl of whole blood sample to get 50–70 μl of serum with high RBC exclusion efficiency. This separation device is also very cost effective and easy-to-use, which costs as low as $2.00–3.00 per test and requires only three simple operations to separate a raw blood sample in 5 min.
ACKNOWLEDGMENTS
This work was supported by National Science and Technology Major Project of China (Grant No. 2017ZX10302101-001-002), National Natural Science Foundation of China (Grant No. 81501835), Natural Science Foundation of Fujian Province (Grant No. 2017J05136), and Xiamen Science and Technology Program key projects (Grant No. 3502Z20171001-20170302).
There are no conflicts to declare.
Contributor Information
Shiyin Zhang, Email: .
Shengxiang Ge, Email: .
References
- 1. Jung W., Han J., Choi J.-W., and Ahn C. H., Microelectron. Eng. 132, 46–57 (2015). 10.1016/j.mee.2014.09.024 [DOI] [Google Scholar]
- 2. Kersaudy-Kerhoas M. and Sollier E., Lab Chip 13, 3323–3346 (2013). 10.1039/c3lc50432h [DOI] [PubMed] [Google Scholar]
- 3. Tripathi S., Varun Kumar Y. V. B., Prabhakar A., Joshi S. S., and Agrawal A., J. Micromech. Microeng. 25, 084004 (2015). 10.1088/0960-1317/25/8/084004 [DOI] [Google Scholar]
- 4. Tripathi S., Varun Kumar Y. V. B., Prabhakar A., Joshi S. S., and Agrawal A., J. Micromech. Microeng. 25, 083001 (2015). 10.1088/0960-1317/25/8/083001 [DOI] [Google Scholar]
- 5. Madadi H., Casals-Terre J., and Mohammadi M., Biofabrication 7, 025007 (2015). 10.1088/1758-5090/7/2/025007 [DOI] [PubMed] [Google Scholar]
- 6. Yan S., Zhang J., Alici G., Du H., Zhu Y., and Li W., Lab Chip 14, 2993–3003 (2014). 10.1039/C4LC00343H [DOI] [PubMed] [Google Scholar]
- 7. Lee M. G., Shin J. H., Choi S., and Park J.-K., Sens. Actuators, B 190, 311–317 (2014). 10.1016/j.snb.2013.08.092 [DOI] [Google Scholar]
- 8. Tripathi S., Prabhakar A., Kumar N., Singh S. G., and Agrawal A., Biomed. Microdevices 15, 415–425 (2013). 10.1007/s10544-013-9738-z [DOI] [PubMed] [Google Scholar]
- 9. Kang T. G., Yoon Y.-J., Ji H., Lim P. Y., and Chen Y., J. Micromech. Microeng. 24, 087001 (2014). 10.1088/0960-1317/24/8/087001 [DOI] [Google Scholar]
- 10. Chen J., Chen D., Yuan T., Chen X., Xie Y., Fu H., Cui D., Fan X., and Khaing Oo M. K., Microelectron. Eng. 128, 36–41 (2014). 10.1016/j.mee.2014.05.032 [DOI] [Google Scholar]
- 11. Lee K. K. and Ahn C. H., Lab Chip 13, 3261–3267 (2013). 10.1039/c3lc50370d [DOI] [PubMed] [Google Scholar]
- 12. Shim J. S. and Ahn C. H., Lab Chip 12, 863–866 (2012). 10.1039/c2lc21009f [DOI] [PubMed] [Google Scholar]
- 13. Shim J. S., Browne A. W., and Ahn C. H., Biomed. Microdevices 12, 949–957 (2010). 10.1007/s10544-010-9449-7 [DOI] [PubMed] [Google Scholar]
- 14. Ji H. M., Samper V., Chen Y., Heng C. K., Lim T. M., and Yobas L., Biomed. Microdevices 10, 251–257 (2008). 10.1007/s10544-007-9131-x [DOI] [PubMed] [Google Scholar]
- 15. Chen X., Cui D., Liu C., and Li H., Sens. Actuators, B 130, 216–221 (2008). 10.1016/j.snb.2007.07.126 [DOI] [Google Scholar]
- 16. VanDelinder V. and Groisman A., Anal. Chem. 78, 3765–3771 (2006). 10.1021/ac060042r [DOI] [PubMed] [Google Scholar]
- 17. Crowley T. A. and Pizziconi V., Lab Chip 5, 922–929 (2005). 10.1039/b502930a [DOI] [PubMed] [Google Scholar]
- 18. Liu C., Liao S. C., Song J., Mauk M. G., Li X., Wu G., Ge D., Greenberg R. M., Yang S., and Bau H. H., Lab Chip 16, 553–560 (2016). 10.1039/C5LC01235J [DOI] [PMC free article] [PubMed] [Google Scholar]
- 19. Liu C., Mauk M., Gross R., Bushman F. D., Edelstein P. H., Collman R. G., and Bau H. H., Anal. Chem. 85, 10463–10470 (2013). 10.1021/ac402459h [DOI] [PMC free article] [PubMed] [Google Scholar]
- 20. Gong M. M., Macdonald B. D., Vu Nguyen T., Van Nguyen K., and Sinton D., Biomicrofluidics 7, 44111 (2013). 10.1063/1.4817792 [DOI] [PMC free article] [PubMed] [Google Scholar]
- 21. Wang S., Sarenac D., Chen M. H., Huang S. H., Giguel F. F., Kuritzkes D. R., and Demirci U., Int. J. Nanomed. 7, 5019–5028 (2012). 10.2147/IJN.S32579 [DOI] [PMC free article] [PubMed] [Google Scholar]
- 22. Thorslund S., Klett O., Nikolajeff F., Markides K., and Bergquist J., Biomed. Microdevices 8, 73–79 (2006). 10.1007/s10544-006-6385-7 [DOI] [PubMed] [Google Scholar]
- 23. Yeh E. C., Fu C. C., Hu L., Thakur R., Feng J., and Lee L. P., Sci. Adv. 3, e1501645 (2017). 10.1126/sciadv.1501645 [DOI] [PMC free article] [PubMed] [Google Scholar]
- 24. Son J. H., Lee S. H., Hong S., Park S. M., Lee J., Dickey A. M., and Lee L. P., Lab Chip 14, 2287–2292 (2014). 10.1039/C4LC00149D [DOI] [PubMed] [Google Scholar]
- 25. Zhang X. B., Wu Z. Q., Wang K., Zhu J., Xu J. J., Xia X. H., and Chen H. Y., Anal. Chem. 84, 3780–3786 (2012). 10.1021/ac3003616 [DOI] [PubMed] [Google Scholar]
- 26. Dimov I. K., Basabe-Desmonts L., Garcia-Cordero J. L., Ross B. M., Park Y., Ricco A. J., and Lee L. P., Lab Chip 11, 845–850 (2011). 10.1039/C0LC00403K [DOI] [PubMed] [Google Scholar]
- 27. Dacie J. V., Crookston J. H., and Christenson W. N., Br. J. Haematol. 3, 77–87 (1957). 10.1111/j.1365-2141.1957.tb05773.x [DOI] [PubMed] [Google Scholar]


