
Figure 3.
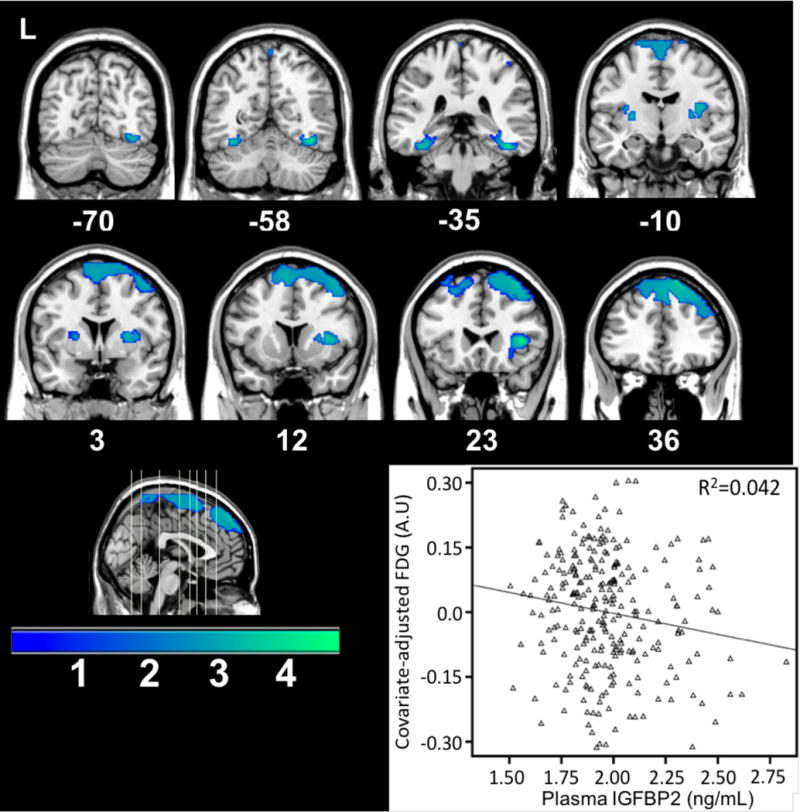
Brain areas showing less FDG metabolism corresponding to increased plasma IGFBP-2. The graph depicts the relationship at a sub-maximal voxel in the dorsal prefrontal cortex.
Official websites use .gov
A
.gov website belongs to an official
government organization in the United States.
Secure .gov websites use HTTPS
A lock (
) or https:// means you've safely
connected to the .gov website. Share sensitive
information only on official, secure websites.
Brain areas showing less FDG metabolism corresponding to increased plasma IGFBP-2. The graph depicts the relationship at a sub-maximal voxel in the dorsal prefrontal cortex.