
Figure 4.
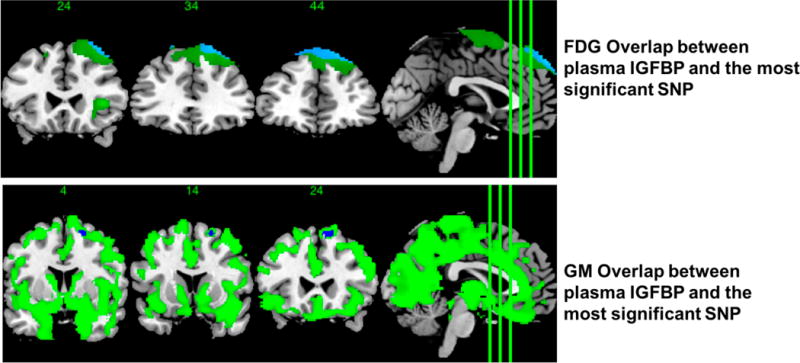
Brain areas showing overlap between either the GM or FDG and IGFBP2 result maps and the result map of the strongest SNP association for GM or FDG.
Official websites use .gov
A
.gov website belongs to an official
government organization in the United States.
Secure .gov websites use HTTPS
A lock (
) or https:// means you've safely
connected to the .gov website. Share sensitive
information only on official, secure websites.
Brain areas showing overlap between either the GM or FDG and IGFBP2 result maps and the result map of the strongest SNP association for GM or FDG.