
Figure 1.
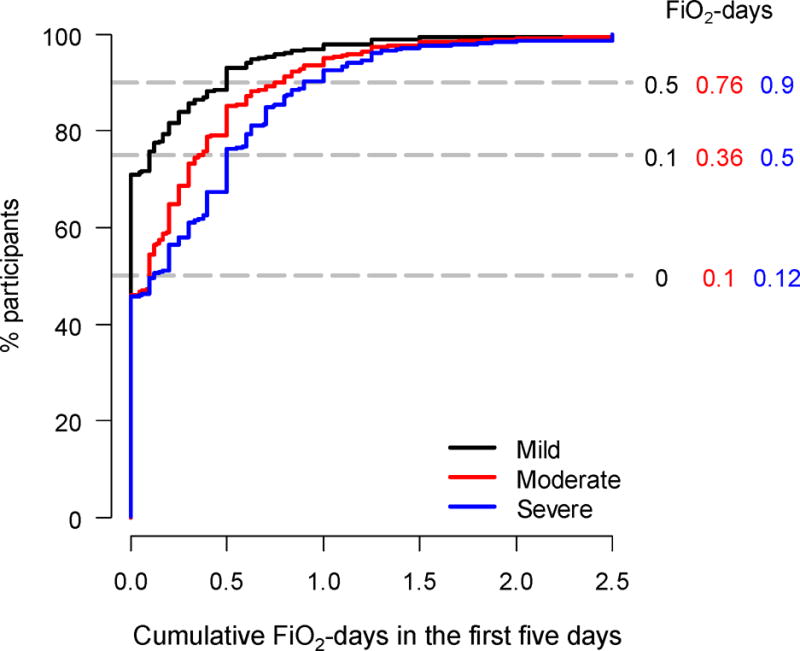
Empirical cumulative distribution of above goal oxygen exposure at five days stratified by severity of ARDS. The 50th, 75th, and 90th percentiles of cumulative above goal oxygen exposure are shown by the horizontal dashed lines. Exposures of FiO2-days for each of these percentiles are indicated to the right of the horizontal dashed lines according to ARDS severity.