
Figure 2.
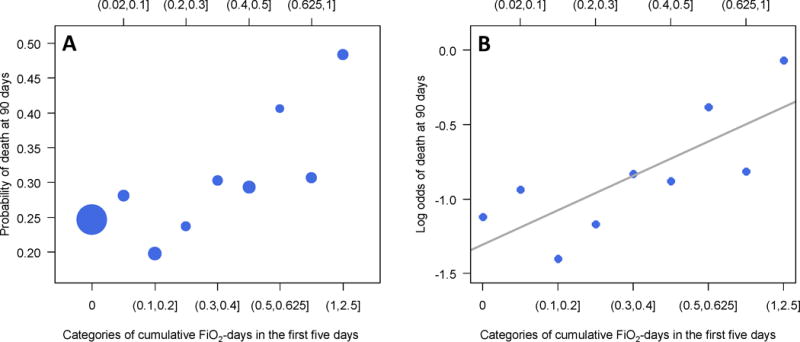
Probability (Panel A) and log odds (Panel B) of hospital mortality at 90 days by categories of cumulative above goal oxygen exposure at five days. In panel A, the sizes of filled circles are proportional to the sample size in each category. This graph could mean either that above goal oxygen exposure is detrimental, or that participants with more severe ARDS are more likely to die and also receive more above goal oxygen exposure.