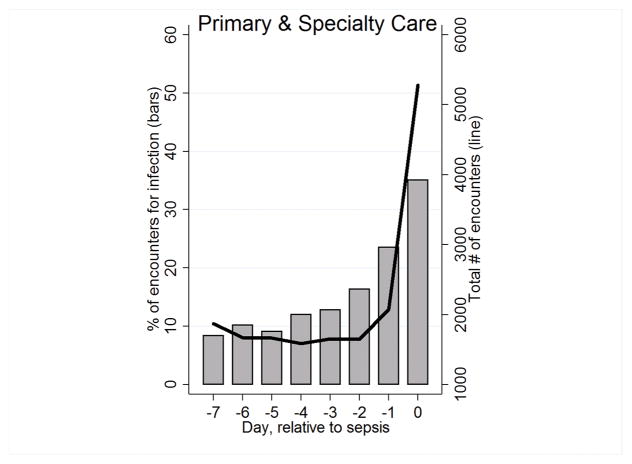
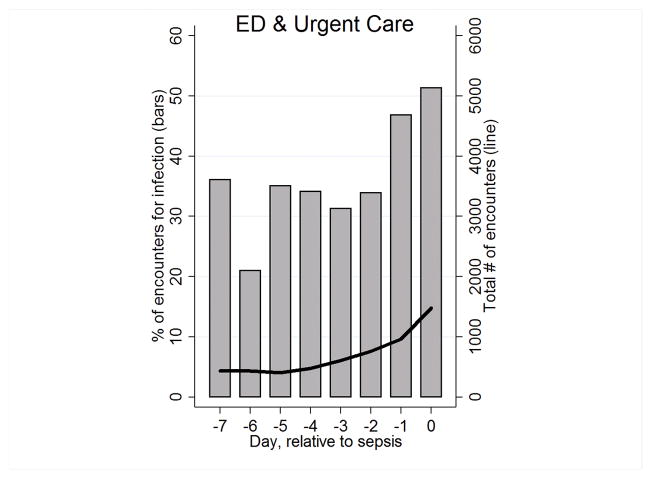
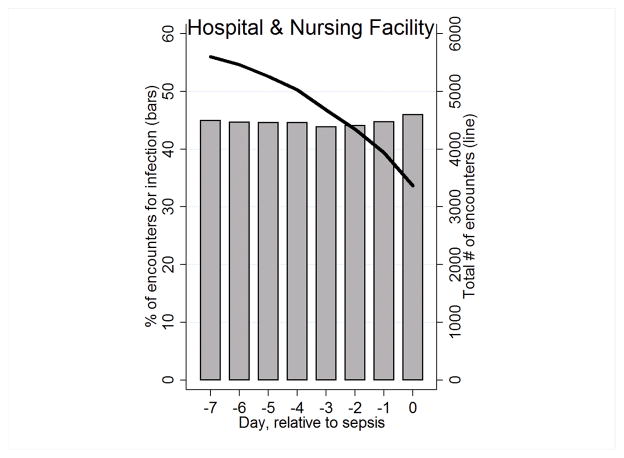
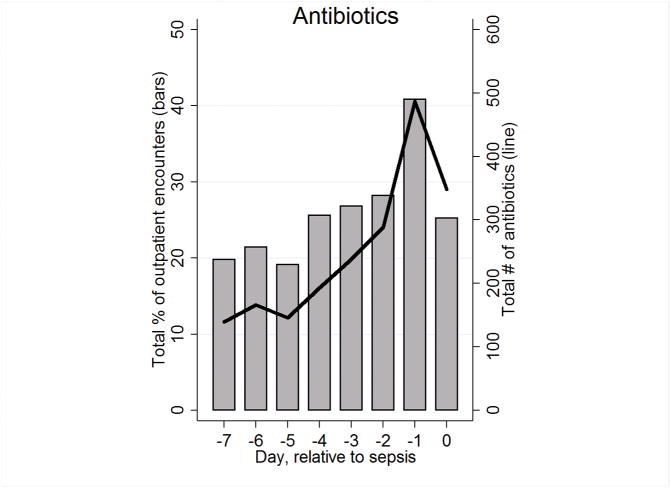
Figure 1. Figure panels show the total number of encounters or antibiotics (lines) and the percentage of encounters with infection or antibiotics (bars) in the week prior to sepsis hospitalization drawn from a total sample of 14,658 KP and 31,369 VA sepsis patients.
Panels display changes over time in: primary care and specialty care (Figure 1a); emergency department and urgent care (Figure 1b); hospitalization and nursing facility (Figure 1c); and in antibiotic usage relative to outpatient visits. On the x-axis, day 0 represents the day of sepsis admission while day −7 represents 7 days prior to admission.


